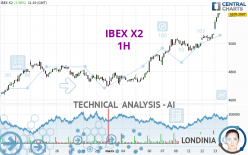
IBEX X2 - 1H - Technical analysis published on 03/13/2024 (GMT)
- 114
- 0
Click here for a new analysis!
- Timeframe : 1H
- - Analysis generated on
- Status : LEVEL MAINTAINED

Summary of the analysis

Additional analysis
Quotes
IBEX X2 rating 5,204.2998 EUR. On the day, this instrument gained +2.88% with the lowest point at 5,099.7002 EUR and the highest point at 5,217.2002 EUR. The deviation from the price is +2.05% for the low point and -0.25% for the high point.The Central Gaps scanner detects the formation of a bullish gap marking the strong presence of buyers against sellers at the opening. This formed a quotation gap.
Opening Gap UP
Type : Bullish
Timeframe : Openning
Here is a more detailed summary of the historical variations registered by IBEX X2:
New HIGH record (1 year)
Type : Bullish
Timeframe : Weekly
New HIGH record (1st january)
Type : Bullish
Timeframe : Weekly
New HIGH record (1 month)
Type : Bullish
Timeframe : Weekly
Technical
Technical analysis of IBEX X2 in 1H shows a strongly overall bullish trend. 92.86% of the signals given by moving averages are bullish. The overall trend is supported by the strong bullish signals from short-term moving averages. The Central Indicators market scanner currently does not detect any result that concerns moving averages.
In fact, according to the parameters integrated into the Central Analyzer system, 17 technical indicators out of 18 analysed are currently bullish. But beware of excesses. The Central Indicators scanner currently detects this:
RSI indicator is overbought : over 80
Type : Neutral
Timeframe : 1 hour
CCI indicator is overbought : over 100
Type : Neutral
Timeframe : 1 hour
Previous candle closed over Bollinger bands
Type : Neutral
Timeframe : 1 hour
Williams %R indicator is overbought : over -20
Type : Neutral
Timeframe : 1 hour
Pivot points : price is over resistance 1
Type : Neutral
Timeframe : Weekly
Pivot points : price is over resistance 3
Type : Neutral
Timeframe : 1 hour
No signals are given by Central Patterns, a market scanner specialised in chart patterns, resistances and supports.
Central Candlesticks, the scanner specialised in Japanese candlesticks, detects these signals that could have an impact on the current short-term trend:
Bearish harami
Type : Bearish
Timeframe : 1 hour
Doji
Type : Neutral
Timeframe : 1 hour
Bearish harami cross
Type : Bearish
Timeframe : 1 hour
| S3 | S2 | S1 | Price | R1 | R2 | R3 | |
|---|---|---|---|---|---|---|---|
| ProTrendLines | 4,695.7817 | 4,829.4000 | 5,004.5000 | 5,204.2998 | 6,128.7856 | 7,947.7000 | 10,196.1000 |
| Change (%) | -9.77% | -7.20% | -3.84% | - | +17.76% | +52.71% | +95.92% |
| Change | -508.5181 | -374.8998 | -199.7998 | - | +924.4858 | +2,743.4002 | +4,991.8002 |
| Level | Intermediate | Intermediate | Major | - | Minor | Minor | Major |
To determine price objectives, it is also possible to use the pivot points. Here is the price position in relation to pivot points:
| Pivot points | S3 | S2 | S1 | PP | R1 | R2 | R3 |
|---|---|---|---|---|---|---|---|
| Standard | 4,965.9336 | 4,989.9668 | 5,024.2334 | 5,048.2666 | 5,082.5332 | 5,106.5664 | 5,140.8330 |
| Camarilla | 5,042.4676 | 5,047.8117 | 5,053.1559 | 5,058.5000 | 5,063.8442 | 5,069.1883 | 5,074.5325 |
| Woodie | 4,971.0503 | 4,992.5252 | 5,029.3501 | 5,050.8250 | 5,087.6499 | 5,109.1248 | 5,145.9497 |
| Fibonacci | 4,989.9668 | 5,012.2373 | 5,025.9961 | 5,048.2666 | 5,070.5371 | 5,084.2959 | 5,106.5664 |
| Pivot points | S3 | S2 | S1 | PP | R1 | R2 | R3 |
|---|---|---|---|---|---|---|---|
| Standard | 4,470.8665 | 4,596.4333 | 4,788.3665 | 4,913.9333 | 5,105.8665 | 5,231.4333 | 5,423.3665 |
| Camarilla | 4,892.9873 | 4,922.0915 | 4,951.1956 | 4,980.2998 | 5,009.4040 | 5,038.5081 | 5,067.6123 |
| Woodie | 4,504.0498 | 4,613.0249 | 4,821.5498 | 4,930.5249 | 5,139.0498 | 5,248.0249 | 5,456.5498 |
| Fibonacci | 4,596.4333 | 4,717.7183 | 4,792.6483 | 4,913.9333 | 5,035.2183 | 5,110.1483 | 5,231.4333 |
| Pivot points | S3 | S2 | S1 | PP | R1 | R2 | R3 |
|---|---|---|---|---|---|---|---|
| Standard | 4,208.8338 | 4,381.9670 | 4,539.0335 | 4,712.1667 | 4,869.2332 | 5,042.3664 | 5,199.4329 |
| Camarilla | 4,605.2952 | 4,635.5635 | 4,665.8318 | 4,696.1001 | 4,726.3684 | 4,756.6367 | 4,786.9050 |
| Woodie | 4,200.8006 | 4,377.9503 | 4,531.0003 | 4,708.1500 | 4,861.2000 | 5,038.3497 | 5,191.3997 |
| Fibonacci | 4,381.9670 | 4,508.1033 | 4,586.0304 | 4,712.1667 | 4,838.3030 | 4,916.2301 | 5,042.3664 |
Numerical data
The following is the status of the technical indicators and moving averages at the time of publication of this technical analysis:
| RSI (14): | 82.25 | |
| MACD (12,26,9): | 51.4724 | |
| Directional Movement: | 40.1132 | |
| AROON (14): | 92.8571 | |
| DEMA (21): | 5,123.1954 | |
| Parabolic SAR (0,02-0,02-0,2): | 5,041.9615 | |
| Elder Ray (13): | 110.7571 | |
| Super Trend (3,10): | 5,097.3045 | |
| Zig ZAG (10): | 5,212.5000 | |
| VORTEX (21): | 1.2994 | |
| Stochastique (14,3,5): | 99.30 | |
| TEMA (21): | 5,142.1159 | |
| Williams %R (14): | -1.79 | |
| Chande Momentum Oscillator (20): | 174.1001 | |
| Repulse (5,40,3): | 1.7747 | |
| ROCnROLL: | 1 | |
| TRIX (15,9): | 0.1081 | |
| Courbe Coppock: | 5.29 |
| MA7: | 4,988.9570 | |
| MA20: | 4,829.6500 | |
| MA50: | 4,757.6880 | |
| MA100: | 4,647.2760 | |
| MAexp7: | 5,149.4297 | |
| MAexp20: | 5,061.1531 | |
| MAexp50: | 4,984.3539 | |
| MAexp100: | 4,909.0774 | |
| Price / MA7: | +4.32% | |
| Price / MA20: | +7.76% | |
| Price / MA50: | +9.39% | |
| Price / MA100: | +11.99% | |
| Price / MAexp7: | +1.07% | |
| Price / MAexp20: | +2.83% | |
| Price / MAexp50: | +4.41% | |
| Price / MAexp100: | +6.01% |
About author
Online


Add a comment
Comments
0 comments on the analysis IBEX X2 - 1H