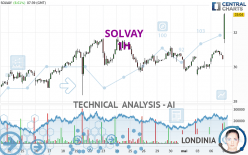
SOLVAY - 1H - Technical analysis published on 05/07/2024 (GMT)
- 90
- 0
Click here for a new analysis!
- Timeframe : 1H
- - Analysis generated on
- Status : TARGET REACHED

Summary of the analysis

Additional analysis
Quotes
SOLVAY rating 32.27 EUR. The price registered an increase of +6.08% on the session with the lowest point at 31.36 EUR and the highest point at 32.37 EUR. The deviation from the price is +2.90% for the low point and -0.31% for the high point.The Central Gaps scanner detects the formation of a bullish gap marking the strong presence of buyers against sellers at the opening. This formed a quotation gap.
Opening Gap UP
Type : Bullish
Timeframe : Openning
A study of price movements over other periods shows the following variations:
New HIGH record (5 years)
Type : Bullish
Timeframe : Weekly
New HIGH record (1 year)
Type : Bullish
Timeframe : Weekly
New HIGH record (1st january)
Type : Bullish
Timeframe : Weekly
New HIGH record (1 month)
Type : Bullish
Timeframe : Weekly
Technical
Technical analysis of SOLVAY in 1H shows a strongly overall bullish trend. 85.71% of the signals given by moving averages are bullish. The overall trend is supported by the strong bullish signals from short-term moving averages. An assessment of moving averages reveals several bullish signals that could impact this trend:
Moving Average bullish crossovers : MA20 & MA50
Type : Bullish
Timeframe : 1 hour
Bullish price crossover with Moving Average 100
Type : Bullish
Timeframe : 1 hour
Bullish price crossover with adaptative moving average 20
Type : Bullish
Timeframe : 1 hour
Bullish price crossover with adaptative moving average 50
Type : Bullish
Timeframe : 1 hour
Bullish price crossover with adaptative moving average 100
Type : Bullish
Timeframe : 1 hour
Technical indicators are strongly bullish, suggesting that the price increase should continue.
Caution: the Central Indicators scanner currently detects an excess:
RSI indicator is overbought : over 70
Type : Neutral
Timeframe : 1 hour
CCI indicator is overbought : over 100
Type : Neutral
Timeframe : 1 hour
Williams %R indicator is overbought : over -20
Type : Neutral
Timeframe : 1 hour
Pivot points : price is over resistance 2
Type : Neutral
Timeframe : Weekly
Pivot points : price is over resistance 3
Type : Neutral
Timeframe : 1 hour
Ichimoku : price is over the cloud
Type : Bullish
Timeframe : 1 hour
The analysis of the price chart with Central Patterns scanners does not return any result.
Central Candlesticks, the scanner specialised in Japanese candlesticks, detects a bullish signal that could support the hypothesis of a small rebound in the very short term:
Long white line
Type : Bullish
Timeframe : 1 hour
| S3 | S2 | S1 | Price | |
|---|---|---|---|---|
| ProTrendLines | 30.72 | 31.18 | 31.57 | 32.27 |
| Change (%) | -4.80% | -3.38% | -2.17% | - |
| Change | -1.55 | -1.09 | -0.70 | - |
| Level | Minor | Intermediate | Major | - |
Pivot points can also be used to set your price objectives. Here is the price situation in relation to pivot points:
| Pivot points | S3 | S2 | S1 | PP | R1 | R2 | R3 |
|---|---|---|---|---|---|---|---|
| Standard | 29.19 | 29.67 | 30.04 | 30.52 | 30.89 | 31.37 | 31.74 |
| Camarilla | 30.19 | 30.26 | 30.34 | 30.42 | 30.50 | 30.58 | 30.65 |
| Woodie | 29.15 | 29.64 | 30.00 | 30.49 | 30.85 | 31.34 | 31.70 |
| Fibonacci | 29.67 | 29.99 | 30.19 | 30.52 | 30.84 | 31.04 | 31.37 |
| Pivot points | S3 | S2 | S1 | PP | R1 | R2 | R3 |
|---|---|---|---|---|---|---|---|
| Standard | 27.69 | 28.59 | 29.37 | 30.27 | 31.05 | 31.95 | 32.73 |
| Camarilla | 29.68 | 29.83 | 29.99 | 30.14 | 30.29 | 30.45 | 30.60 |
| Woodie | 27.62 | 28.56 | 29.30 | 30.24 | 30.98 | 31.92 | 32.66 |
| Fibonacci | 28.59 | 29.24 | 29.63 | 30.27 | 30.92 | 31.31 | 31.95 |
| Pivot points | S3 | S2 | S1 | PP | R1 | R2 | R3 |
|---|---|---|---|---|---|---|---|
| Standard | 20.11 | 22.70 | 26.56 | 29.15 | 33.01 | 35.60 | 39.46 |
| Camarilla | 28.64 | 29.23 | 29.82 | 30.41 | 31.00 | 31.59 | 32.18 |
| Woodie | 20.74 | 23.02 | 27.19 | 29.47 | 33.64 | 35.92 | 40.09 |
| Fibonacci | 22.70 | 25.17 | 26.69 | 29.15 | 31.62 | 33.14 | 35.60 |
Numerical data
The following are the details of the technical indicators and moving averages that were collected to generate this technical analysis:
| RSI (14): | 72.81 | |
| MACD (12,26,9): | 0.2200 | |
| Directional Movement: | 31.97 | |
| AROON (14): | 85.71 | |
| DEMA (21): | 30.88 | |
| Parabolic SAR (0,02-0,02-0,2): | 30.40 | |
| Elder Ray (13): | 1.09 | |
| Super Trend (3,10): | 30.66 | |
| Zig ZAG (10): | 32.14 | |
| VORTEX (21): | 1.0600 | |
| Stochastique (14,3,5): | 70.48 | |
| TEMA (21): | 31.10 | |
| Williams %R (14): | -10.40 | |
| Chande Momentum Oscillator (20): | 1.99 | |
| Repulse (5,40,3): | 0.6600 | |
| ROCnROLL: | 1 | |
| TRIX (15,9): | 0.0400 | |
| Courbe Coppock: | 5.91 |
| MA7: | 30.64 | |
| MA20: | 30.14 | |
| MA50: | 26.79 | |
| MA100: | 25.64 | |
| MAexp7: | 30.95 | |
| MAexp20: | 30.64 | |
| MAexp50: | 30.50 | |
| MAexp100: | 30.26 | |
| Price / MA7: | +5.32% | |
| Price / MA20: | +7.07% | |
| Price / MA50: | +20.46% | |
| Price / MA100: | +25.86% | |
| Price / MAexp7: | +4.26% | |
| Price / MAexp20: | +5.32% | |
| Price / MAexp50: | +5.80% | |
| Price / MAexp100: | +6.64% |
News
Don't forget to follow the news on SOLVAY. At the time of publication of this analysis, the latest news was as follows:
- Solvay first quarter 2024 results
- Solvay fourth quarter and full-year 2023 results
- Syensqo is born following overwhelming support of shareholders on demerger of Solvay
- Shareholders overwhelmingly support the creation of two independent companies - Solvay and Syensqo
- Solvay announces the publication of a supplement to its information document
About author
Online


Add a comment
Comments
0 comments on the analysis SOLVAY - 1H