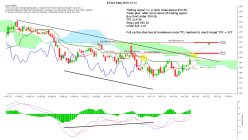
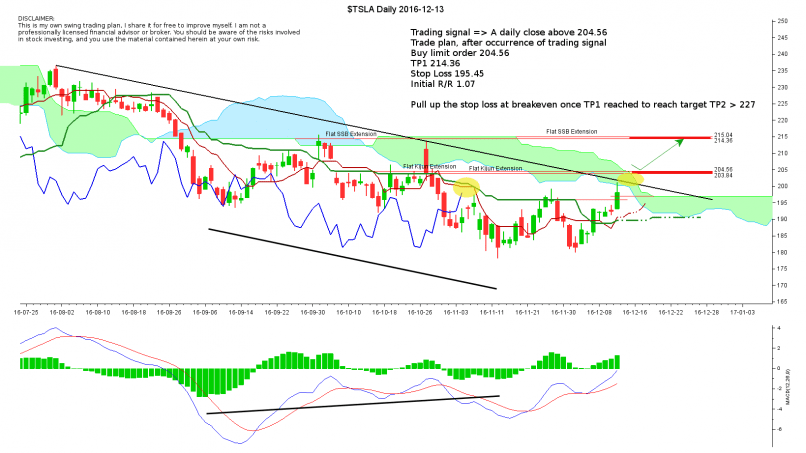
TESLA INC. - Below an important resistance line in front of a weak cloud #Ichimoku - 12/13/2016 (GMT)
- Who voted?
- 1246
- 2
- Chart + Trading signal
- Signal : Buy signal
- |
- Entry price recommended : 204,56
- |
- Stop loss : 195,45
- |
- Take profit : 214,36
- Timeframe : Daily
TESLA INC. Chart
Are you looking for opportunities in American stocks?
DISCOVER LONDINIA OPPORTUNITIES...
DISCOVER LONDINIA OPPORTUNITIES...
Since several weeks the candles evolve below a falling line, today a candle gets closer of this resistance. The Ichimoku cloud suggest that the resistance is the weakest because of a thinner cloud in next days. In case of cloud breakout confirmed by a daily closing above a flat Kijun extension at 204.56, it could be possible to rally an other resistance area starting at 214.36.
See the chart for a trading signal and a plan.
See the chart for a trading signal and a plan.
This member did not declare if he had a position on this financial instrument or a related financial instrument.
About author

Offline


Add a comment
Comments
2 comments on the analysis TESLA INC. - Daily