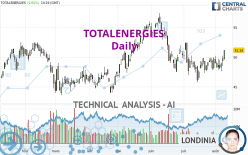
TOTALENERGIES - Daily - Technical analysis published on 08/09/2022 (GMT)
- 180
- 0
Click here for a new analysis!
- Timeframe : Daily
- - Analysis generated on
- Status : TARGET REACHED

Summary of the analysis

Additional analysis
Quotes
The TOTALENERGIES rating is 51.140 EUR. The price has increased by +2.65% since the last closing and was between 49.565 EUR and 51.230 EUR. This implies that the price is at +3.18% from its lowest and at -0.18% from its highest.A bearish opening was detected by the Central Gaps scanner. Sellers are trying to impose a bearish trend in the very short term.
Bearish opening
Type : Bearish
Timeframe : Openning
A study of price movements over other periods shows the following variations:
New HIGH record (1 month)
Type : Bullish
Timeframe : Weekly
Technical
Technical analysis of this Daily chart of TOTALENERGIES indicates that the overall trend is bullish. 75.00% of the signals given by moving averages are bullish. The overall trend is reinforced by the strong bullish signals from short-term moving averages. An assessment of moving averages reveals several bullish signals that could impact this trend:
Bullish trend reversal : Moving Average 20
Type : Bullish
Timeframe : Daily
Bullish trend reversal : adaptative moving average 20
Type : Bullish
Timeframe : Daily
Bullish trend reversal : adaptative moving average 50
Type : Bullish
Timeframe : Daily
Bullish price crossover with Moving Average 50
Type : Bullish
Timeframe : Daily
Bullish price crossover with adaptative moving average 20
Type : Bullish
Timeframe : Daily
Bullish price crossover with adaptative moving average 50
Type : Bullish
Timeframe : Daily
Technical indicators are strongly bullish, suggesting that the price increase should continue.
Caution: the Central Indicators scanner currently detects an excess:
CCI indicator is overbought : over 100
Type : Neutral
Timeframe : Daily
Williams %R indicator is overbought : over -20
Type : Neutral
Timeframe : Daily
Pivot points : price is over resistance 1
Type : Neutral
Timeframe : Daily
Pivot points : price is over resistance 1
Type : Neutral
Timeframe : Weekly
Ichimoku : price is over the cloud
Type : Bullish
Timeframe : Daily
MACD indicator is back over 0
Type : Bullish
Timeframe : Daily
Ichimoku - Bullish crossover : Tenkan & Kijun
Type : Bullish
Timeframe : Daily
Central Patterns, the scanner specializing in chart patterns, did not identify any signals.
The Central Candlesticks scanner which studies Japanese candlesticks did not detect anything.
| S3 | S2 | S1 | Price | R1 | R2 | |
|---|---|---|---|---|---|---|
| ProTrendLines | 46.090 | 48.051 | 50.966 | 51.140 | 52.430 | 55.778 |
| Change (%) | -9.87% | -6.04% | -0.34% | - | +2.52% | +9.07% |
| Change | -5.050 | -3.089 | -0.174 | - | +1.290 | +4.638 |
| Level | Major | Intermediate | Intermediate | - | Minor | Major |
Pivot points can also be used to set your price objectives. Here is the price situation in relation to pivot points:
| Pivot points | S3 | S2 | S1 | PP | R1 | R2 | R3 |
|---|---|---|---|---|---|---|---|
| Standard | 47.133 | 47.827 | 48.823 | 49.517 | 50.513 | 51.207 | 52.203 |
| Camarilla | 49.355 | 49.510 | 49.665 | 49.820 | 49.975 | 50.130 | 50.285 |
| Woodie | 47.285 | 47.903 | 48.975 | 49.593 | 50.665 | 51.283 | 52.355 |
| Fibonacci | 47.827 | 48.472 | 48.871 | 49.517 | 50.162 | 50.561 | 51.207 |
| Pivot points | S3 | S2 | S1 | PP | R1 | R2 | R3 |
|---|---|---|---|---|---|---|---|
| Standard | 44.990 | 46.310 | 47.600 | 48.920 | 50.210 | 51.530 | 52.820 |
| Camarilla | 48.172 | 48.412 | 48.651 | 48.890 | 49.129 | 49.369 | 49.608 |
| Woodie | 44.975 | 46.303 | 47.585 | 48.913 | 50.195 | 51.523 | 52.805 |
| Fibonacci | 46.310 | 47.307 | 47.923 | 48.920 | 49.917 | 50.533 | 51.530 |
| Pivot points | S3 | S2 | S1 | PP | R1 | R2 | R3 |
|---|---|---|---|---|---|---|---|
| Standard | 39.617 | 42.713 | 46.237 | 49.333 | 52.857 | 55.953 | 59.477 |
| Camarilla | 47.940 | 48.546 | 49.153 | 49.760 | 50.367 | 50.974 | 51.581 |
| Woodie | 39.830 | 42.820 | 46.450 | 49.440 | 53.070 | 56.060 | 59.690 |
| Fibonacci | 42.713 | 45.242 | 46.805 | 49.333 | 51.862 | 53.425 | 55.953 |
Numerical data
The following is the status of technical indicators and moving averages registered at the time this technical analysis was created:
| RSI (14): | 58.64 | |
| MACD (12,26,9): | 0.0100 | |
| Directional Movement: | 3.413 | |
| AROON (14): | 92.857 | |
| DEMA (21): | 49.083 | |
| Parabolic SAR (0,02-0,02-0,2): | 46.316 | |
| Elder Ray (13): | 1.123 | |
| Super Trend (3,10): | 52.474 | |
| Zig ZAG (10): | 51.180 | |
| VORTEX (21): | 1.0140 | |
| Stochastique (14,3,5): | 79.29 | |
| TEMA (21): | 49.453 | |
| Williams %R (14): | -0.77 | |
| Chande Momentum Oscillator (20): | 2.660 | |
| Repulse (5,40,3): | 5.9180 | |
| ROCnROLL: | 1 | |
| TRIX (15,9): | -0.0940 | |
| Courbe Coppock: | 3.93 |
| MA7: | 49.195 | |
| MA20: | 48.779 | |
| MA50: | 50.264 | |
| MA100: | 49.082 | |
| MAexp7: | 49.573 | |
| MAexp20: | 49.226 | |
| MAexp50: | 49.470 | |
| MAexp100: | 48.860 | |
| Price / MA7: | +3.95% | |
| Price / MA20: | +4.84% | |
| Price / MA50: | +1.74% | |
| Price / MA100: | +4.19% | |
| Price / MAexp7: | +3.16% | |
| Price / MAexp20: | +3.89% | |
| Price / MAexp50: | +3.38% | |
| Price / MAexp100: | +4.67% |
News
The latest news and videos published on TOTALENERGIES at the time of the analysis were as follows:
- TotalEnergies: Disclosure of Transactions in Own Shares
- TotalEnergies SE: Statement in Compliance With the Article 223-16 of the General Regulation of the Financial Markets Authority (Autorité des marchés financiers)
- Floating Offshore Wind in France: TotalEnergies, Corio Generation and Qair Join Forces to Bid for Mediterranean Tender
- TotalEnergies: Disclosure of Transactions in Own Shares
- TotalEnergies: Financial Report – 1st half 2022
About author
Online


Add a comment
Comments
0 comments on the analysis TOTALENERGIES - Daily