TOTALENERGIES - Daily - Technical analysis published on 10/05/2022 (GMT)
- 168
- 0
Click here for a new analysis!
- Timeframe : Daily
- - Analysis generated on
- Status : TARGET REACHED

Summary of the analysis

Additional analysis
Quotes
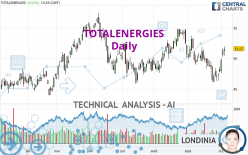
TOTALENERGIES rating 51.570 EUR. The price registered an increase of +0.51% on the session and was between 50.440 EUR and 52.000 EUR. This implies that the price is at +2.24% from its lowest and at -0.83% from its highest.The Central Gaps scanner detects a bearish opening. A small advantage for sellers in the very short term.
Bearish opening
Type : Bearish
Timeframe : Openning
A study of price movements over other periods shows the following variations:
Near a new HIGH record (1 month)
Type : Bullish
Timeframe : Weekly
Technical
Technical analysis of this Daily chart of TOTALENERGIES indicates that the overall trend is bullish. The signals returned by the moving averages are 78.57% bullish. This bullish trend is reinforced by the strong signals currently being given by short-term moving averages. The Central Indicators scanner detects bullish signals on moving averages that could impact this trend:
Bullish trend reversal : Moving Average 20
Type : Bullish
Timeframe : Daily
Bullish trend reversal : Moving Average 100
Type : Bullish
Timeframe : Daily
Technical indicators are strongly bullish, suggesting that the price increase should continue.
Caution: the Central Indicators scanner currently detects an excess:
CCI indicator is overbought : over 100
Type : Neutral
Timeframe : Daily
Williams %R indicator is overbought : over -20
Type : Neutral
Timeframe : Daily
Pivot points : price is over resistance 2
Type : Neutral
Timeframe : Weekly
Ichimoku : price is over the cloud
Type : Bullish
Timeframe : Daily
SuperTrend indicator bullish reversal
Type : Bullish
Timeframe : Daily
An analysis of the price chart with the Central Patterns scanner (detector of chart patterns and resistances and supports) shows several results that can have an impact on the price change:
Near horizontal resistance
Type : Bearish
Timeframe : Daily
Resistance of channel is broken
Type : Bullish
Timeframe : Daily
The Central Candlesticks scanner which studies Japanese candlesticks did not detect anything.
| S3 | S2 | S1 | Price | R1 | R2 | R3 | |
|---|---|---|---|---|---|---|---|
| ProTrendLines | 45.439 | 48.505 | 50.247 | 51.570 | 51.690 | 52.655 | 53.998 |
| Change (%) | -11.89% | -5.94% | -2.57% | - | +0.23% | +2.10% | +4.71% |
| Change | -6.131 | -3.065 | -1.323 | - | +0.120 | +1.085 | +2.428 |
| Level | Intermediate | Intermediate | Intermediate | - | Intermediate | Intermediate | Major |
Pivot points can also be used to set your price objectives. Here is the price situation in relation to pivot points:
| Pivot points | S3 | S2 | S1 | PP | R1 | R2 | R3 |
|---|---|---|---|---|---|---|---|
| Standard | 49.147 | 49.703 | 50.507 | 51.063 | 51.867 | 52.423 | 53.227 |
| Camarilla | 50.936 | 51.061 | 51.185 | 51.310 | 51.435 | 51.559 | 51.684 |
| Woodie | 49.270 | 49.765 | 50.630 | 51.125 | 51.990 | 52.485 | 53.350 |
| Fibonacci | 49.703 | 50.223 | 50.544 | 51.063 | 51.583 | 51.904 | 52.423 |
| Pivot points | S3 | S2 | S1 | PP | R1 | R2 | R3 |
|---|---|---|---|---|---|---|---|
| Standard | 44.073 | 45.092 | 46.683 | 47.702 | 49.293 | 50.312 | 51.903 |
| Camarilla | 47.557 | 47.797 | 48.036 | 48.275 | 48.514 | 48.754 | 48.993 |
| Woodie | 44.360 | 45.235 | 46.970 | 47.845 | 49.580 | 50.455 | 52.190 |
| Fibonacci | 45.092 | 46.089 | 46.705 | 47.702 | 48.699 | 49.315 | 50.312 |
| Pivot points | S3 | S2 | S1 | PP | R1 | R2 | R3 |
|---|---|---|---|---|---|---|---|
| Standard | 38.405 | 42.258 | 45.266 | 49.119 | 52.127 | 55.980 | 58.988 |
| Camarilla | 46.388 | 47.017 | 47.646 | 48.275 | 48.904 | 49.533 | 50.162 |
| Woodie | 37.984 | 42.047 | 44.845 | 48.908 | 51.706 | 55.769 | 58.567 |
| Fibonacci | 42.258 | 44.879 | 46.498 | 49.119 | 51.740 | 53.359 | 55.980 |
Numerical data
The following is the status of the technical indicators and moving averages at the time of publication of this technical analysis:
| RSI (14): | 59.69 | |
| MACD (12,26,9): | -0.0820 | |
| Directional Movement: | 9.722 | |
| AROON (14): | 50.000 | |
| DEMA (21): | 49.008 | |
| Parabolic SAR (0,02-0,02-0,2): | 46.406 | |
| Elder Ray (13): | 1.974 | |
| Super Trend (3,10): | 46.313 | |
| Zig ZAG (10): | 51.580 | |
| VORTEX (21): | 0.9330 | |
| Stochastique (14,3,5): | 86.70 | |
| TEMA (21): | 49.145 | |
| Williams %R (14): | -6.11 | |
| Chande Momentum Oscillator (20): | 3.036 | |
| Repulse (5,40,3): | 5.5640 | |
| ROCnROLL: | 1 | |
| TRIX (15,9): | -0.1590 | |
| Courbe Coppock: | 0.53 |
| MA7: | 49.029 | |
| MA20: | 48.859 | |
| MA50: | 49.889 | |
| MA100: | 50.068 | |
| MAexp7: | 49.679 | |
| MAexp20: | 49.258 | |
| MAexp50: | 49.520 | |
| MAexp100: | 49.152 | |
| Price / MA7: | +5.18% | |
| Price / MA20: | +5.55% | |
| Price / MA50: | +3.37% | |
| Price / MA100: | +3.00% | |
| Price / MAexp7: | +3.81% | |
| Price / MAexp20: | +4.69% | |
| Price / MAexp50: | +4.14% | |
| Price / MAexp100: | +4.92% |
News
The last news published on TOTALENERGIES at the time of the generation of this analysis was as follows:
- Decarbonizing Heavy Industry: TotalEnergies and Holcim Join Forces to Study Solutions for First Carbon-Free Cement Plant in Belgium
- TotalEnergies SE: Disclosure of Transactions in Own Shares
- 2022 Strategy & Outlook Presentation: In Changing Energy Markets, TotalEnergies Demonstrates the Relevance of Its Strategy, Accelerating Its Transformation While Offering Attractive Shareholder Return
- TotalEnergies Energy Outlook 2022: TotalEnergies Publishes its Annual Contribution to the Energy Transition Dialogue
- TotalEnergies SE: Disclosure of Transactions in Own Shares
About author
Online


Add a comment
Comments
0 comments on the analysis TOTALENERGIES - Daily