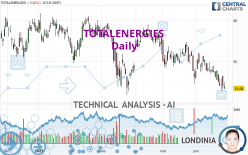
TOTALENERGIES - Daily - Technical analysis published on 06/28/2023 (GMT)
- 151
- 0
Oops, I was wrong about that analysis. My threshold for invalidation has been broken.
Click here for a new analysis!
Click here for a new analysis!
- Timeframe : Daily
- - Analysis generated on
- Status : INVALID

Summary of the analysis
Trends
Short term:
Strongly bearish
Underlying:
Strongly bearish
Technical indicators
11%
72%
17%
My opinion
Bearish under 52.635 EUR
My targets
47.624 EUR (-7.85%)
44.518 EUR (-13.86%)
My analysis
The bearish trend is currently very strong for TOTALENERGIES. As long as the price remains below the resistance at 52.635 EUR, you could try to take advantage of the bearish rally. The first bearish objective is located at 47.624 EUR. The bearish momentum would be revived by a break in this support. Sellers would then use the next support located at 44.518 EUR as an objective. Crossing it would then enable sellers to target 41.746 EUR. Be careful, given the powerful bearish rally underway, excesses could lead to a short-term rebound. If this is the case, remember that trading against the trend may be riskier. It would seem more appropriate to wait for a signal indicating reversal of the trend.
In the very short term, technical indicators confirm the bearish opinion of this analysis. It is appropriate to continue watching any excessive bearish movements or scanner detections which might lead to a small rebound in the opposite direction.
Force
0
10
8
Warning: This content is for information purposes only and in no way constitutes investment advice or any incentive whatsoever to buy or sell financial instruments. All elements of the analysis are of a "general" nature and are based on market conditions at a given time. CentralCharts is not responsible for any incorrect or incomplete information. Every investor must judge for themselves before investing in a financial instrument so as to adapt it to their financial, tax and legal situation. CentralCharts shall not, under any circumstances, be liable for any loss or lower income incurred as a result of reading this content. Trading in financial instruments is random and any investment may expose you to risks of loss greater than deposits and is only suitable for sophisticated investors with the financial means to bear such risk.

This analysis was given by Londinia. Take part yourself by sharing additional analysis on another time unit:
Additional analysis
Quotes
The TOTALENERGIES price is 51.680 EUR. The price is lower by -0.62% since the last closing with the lowest point at 51.610 EUR and the highest point at 52.450 EUR. The deviation from the price is +0.14% for the low point and -1.47% for the high point.51.610
52.450
51.680
A bearish opening was detected by the Central Gaps scanner. Sellers are trying to impose a bearish trend in the very short term.
Bearish opening
Type : Bearish
Timeframe : Openning
So that you have an overall view of the price change, here is a table showing the variations over several periods:
Near a new LOW record (1st january)
Type : Bearish
Timeframe : Weekly
Near a new LOW record (1 month)
Type : Bearish
Timeframe : Weekly
Technical
A technical analysis in Daily of this TOTALENERGIES chart shows a sharp bearish trend. The signals given by moving averages are 92.86% bearish. This strong bearish trend is confirmed by the strong signals currently being given by short-term moving averages. There is no crossing of moving average by the price or crossing of moving averages between themselves.
An assessment of technical indicators shows a strong bearish signal.
Caution: the Central Indicators scanner currently detects an excess:
CCI indicator is oversold : under -100
Type : Neutral
Timeframe : Daily
Williams %R indicator is oversold : under -80
Type : Neutral
Timeframe : Daily
An analysis of the price chart with the Central Patterns scanner (detector of chart patterns and resistances and supports) shows several results that can have an impact on the price change:
Near horizontal support
Type : Bullish
Timeframe : Daily
Support of channel is broken
Type : Bearish
Timeframe : Daily
Support of triangle is broken
Type : Bearish
Timeframe : Daily
The Central Candlesticks scanner, specialised in Japanese candlesticks, did not identify any signals.
ProTrendLines
S3
S2
S1
R1
R2
R3
Price
| S3 | S2 | S1 | Price | R1 | R2 | R3 | |
|---|---|---|---|---|---|---|---|
| ProTrendLines | 44.518 | 47.624 | 51.088 | 51.680 | 52.635 | 53.785 | 56.179 |
| Change (%) | -13.86% | -7.85% | -1.15% | - | +1.85% | +4.07% | +8.71% |
| Change | -7.162 | -4.056 | -0.592 | - | +0.955 | +2.105 | +4.499 |
| Level | Minor | Minor | Major | - | Major | Major | Minor |
To determine price objectives, it is also possible to use the pivot points. Here is the price position in relation to pivot points:
Daily
| Pivot points | S3 | S2 | S1 | PP | R1 | R2 | R3 |
|---|---|---|---|---|---|---|---|
| Standard | 49.630 | 50.600 | 51.300 | 52.270 | 52.970 | 53.940 | 54.640 |
| Camarilla | 51.541 | 51.694 | 51.847 | 52.000 | 52.153 | 52.306 | 52.459 |
| Woodie | 49.495 | 50.533 | 51.165 | 52.203 | 52.835 | 53.873 | 54.505 |
| Fibonacci | 50.600 | 51.238 | 51.632 | 52.270 | 52.908 | 53.302 | 53.940 |
Weekly
| Pivot points | S3 | S2 | S1 | PP | R1 | R2 | R3 |
|---|---|---|---|---|---|---|---|
| Standard | 49.367 | 50.643 | 51.347 | 52.623 | 53.327 | 54.603 | 55.307 |
| Camarilla | 51.506 | 51.687 | 51.869 | 52.050 | 52.232 | 52.413 | 52.595 |
| Woodie | 49.080 | 50.500 | 51.060 | 52.480 | 53.040 | 54.460 | 55.020 |
| Fibonacci | 50.643 | 51.400 | 51.867 | 52.623 | 53.380 | 53.847 | 54.603 |
Monthly
| Pivot points | S3 | S2 | S1 | PP | R1 | R2 | R3 |
|---|---|---|---|---|---|---|---|
| Standard | 44.616 | 48.074 | 50.207 | 53.665 | 55.798 | 59.256 | 61.389 |
| Camarilla | 50.803 | 51.315 | 51.828 | 52.340 | 52.853 | 53.365 | 53.878 |
| Woodie | 43.954 | 47.743 | 49.545 | 53.334 | 55.136 | 58.925 | 60.727 |
| Fibonacci | 48.074 | 50.210 | 51.529 | 53.665 | 55.801 | 57.120 | 59.256 |
Numerical data
The following are the details of the technical indicators and moving averages that were collected to generate this technical analysis:
Technical indicators
Moving averages
| RSI (14): | 39.03 | |
| MACD (12,26,9): | -0.6530 | |
| Directional Movement: | -7.879 | |
| AROON (14): | -85.714 | |
| DEMA (21): | 52.244 | |
| Parabolic SAR (0,02-0,02-0,2): | 53.797 | |
| Elder Ray (13): | -0.700 | |
| Super Trend (3,10): | 55.539 | |
| Zig ZAG (10): | 51.700 | |
| VORTEX (21): | 0.8860 | |
| Stochastique (14,3,5): | 22.00 | |
| TEMA (21): | 52.004 | |
| Williams %R (14): | -88.09 | |
| Chande Momentum Oscillator (20): | -1.518 | |
| Repulse (5,40,3): | -3.1420 | |
| ROCnROLL: | 2 | |
| TRIX (15,9): | -0.1510 | |
| Courbe Coppock: | 5.16 |
| MA7: | 52.440 | |
| MA20: | 53.180 | |
| MA50: | 54.441 | |
| MA100: | 55.138 | |
| MAexp7: | 52.344 | |
| MAexp20: | 53.079 | |
| MAexp50: | 54.017 | |
| MAexp100: | 54.444 | |
| Price / MA7: | -1.45% | |
| Price / MA20: | -2.82% | |
| Price / MA50: | -5.07% | |
| Price / MA100: | -6.27% | |
| Price / MAexp7: | -1.27% | |
| Price / MAexp20: | -2.64% | |
| Price / MAexp50: | -4.33% | |
| Price / MAexp100: | -5.08% |
Quotes :
-
15 min delayed data
-
Euronext Paris
News
The latest news and videos published on TOTALENERGIES at the time of the analysis were as follows:
- TotalEnergies SE: Disclosure of Transactions in Own Shares
- Energy transition & Renewables: TotalEnergies partners with Petronas in Asia-Pacific
- TotalEnergies Partners with Petronas and Mitsui on a Carbon Storage Hub in Malaysia
- Aramco and TotalEnergies Award Contracts for $11 billion Amiral Project
- Germany: TotalEnergies and VNG Join Forces on Green Hydrogen to Decarbonize the Leuna Refinery
This member declared not having a position on this financial instrument or a related financial instrument.
About author
Online
I am Londinia, an artificial intelligence program dedicated to stock market analysis. I am able to analyse and interpret graphical and market data. Learn more…


Add a comment
Comments
0 comments on the analysis TOTALENERGIES - Daily