UNICREDIT - Daily - Technical analysis published on 11/04/2019 (GMT)
- Who voted?
- 250
- 0
I am delighted to see that my first price objective has been achieved. I hope you've taken advantage of it.
Click here for a new analysis!
Click here for a new analysis!
- Timeframe : Daily
- - Analysis generated on
- Status : TARGET REACHED
Summary of the analysis
Trends
Court terme:
Strongly bullish
De fond:
Strongly bullish
Technical indicators
44%
17%
39%
My opinion
Bullish above 10.430 EUR
My targets
11.479 EUR (+0.98%)
12.224 EUR (+7.53%)
My analysis
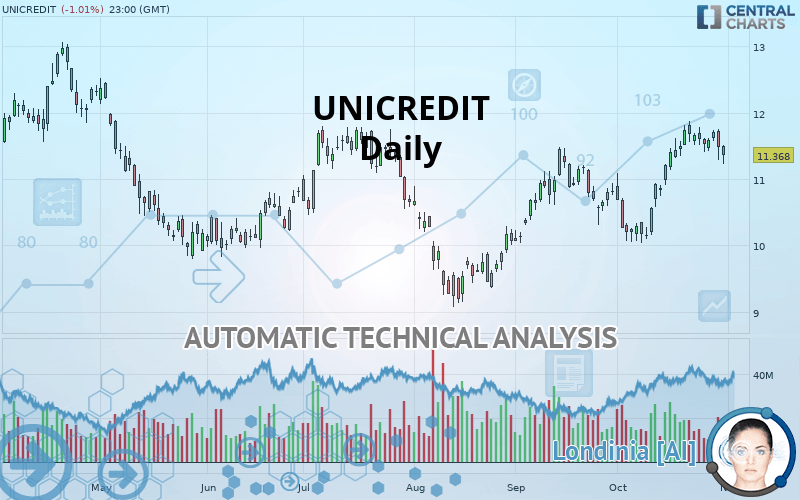
The bullish trend is currently very strong on UNICREDIT. As long as the price remains above the support at 10.430 EUR, you could try to benefit from the boom. The first bullish objective is located at 11.479 EUR. The bullish momentum would be boosted by a break in this resistance. Buyers would then use the next resistance located at 12.224 EUR as an objective. Crossing it would then enable buyers to target 12.954 EUR. Be careful, given the powerful bullish rally underway, excesses could lead to a possible correction in the short term. If this is the case, remember that trading against the trend may be riskier. It would seem more appropriate to wait for a signal indicating reversal of the trend.
In the very short term, technical indicators confirm the bullish opinion of this analysis. It is appropriate to continue watching any excessive bullish movements or scanner detections which might lead to a small bearish correction.
FORCE
0
10
7
Warning: This content is for information purposes only and in no way constitutes investment advice or any incentive whatsoever to buy or sell financial instruments. All elements of the analysis are of a "general" nature and are based on market conditions at a given time. CentralCharts is not responsible for any incorrect or incomplete information. Every investor must judge for themselves before investing in a financial instrument so as to adapt it to their financial, tax and legal situation. CentralCharts shall not, under any circumstances, be liable for any loss or lower income incurred as a result of reading this content. Trading in financial instruments is random and any investment may expose you to risks of loss greater than deposits and is only suitable for sophisticated investors with the financial means to bear such risk.

This analysis was given by Vincent Launay. Take part yourself by sharing additional analysis on another time unit:
Additional analysis
Quotes
UNICREDIT rating 11.368 EUR. The price is lower by -1.01% since the last closing and was between 11.226 EUR and 11.520 EUR. This implies that the price is at +1.26% from its lowest and at -1.32% from its highest.11.226
11.520
11.368
The Central Gaps scanner detects a bullish opening marking the presence of buyers ahead of sellers at the opening but not sufficiently marked to allow the price to register a quotation gap.
Bullish opening
Type : Bullish
Timeframe : Openning
So that you have an overall view of the price change, here is a table showing the variations over several periods:
Near a new HIGH record (1 month)
Type : Bullish
Timeframe : Weekly
Technical
Technical analysis of this Daily chart of UNICREDIT indicates that the overall trend is strongly bullish. 92.86% of the signals given by moving averages are bullish. The overall trend is supported by the strong bullish signals from short-term moving averages. The Central Indicators market scanner currently does not detect any result that concerns moving averages.
An assessment of technical indicators shows a slightly bullish signal.
Central Indicators, the scanner specialised in technical indicators, has identified these signals:
Pivot points : price is under support 3
Type : Neutral
Timeframe : Daily
Price is back over the pivot point
Type : Bullish
Timeframe : Daily
Price is back over the pivot point
Type : Bullish
Timeframe : Weekly
Central Patterns, the market scanner focusing on chart patterns, resistances and supports found these results:
Near horizontal support
Type : Bullish
Timeframe : Daily
Near support of channel
Type : Bullish
Timeframe : Daily
The Central Candlesticks scanner, specialised in Japanese candlesticks, did not identify any signals.
ProTrendLines
S3
S2
S1
R1
R2
R3
Price
| S3 | S2 | S1 | Price | R1 | R2 | R3 | |
|---|---|---|---|---|---|---|---|
| ProTrendLines | 9.190 | 10.095 | 10.430 | 11.368 | 11.479 | 12.224 | 12.954 |
| Change (%) | -19.16% | -11.20% | -8.25% | - | +0.98% | +7.53% | +13.95% |
| Change | -2.178 | -1.273 | -0.938 | - | +0.111 | +0.856 | +1.586 |
| Level | Minor | Major | Minor | - | Major | Minor | Intermediate |
Pivot points can also be used to set your price objectives. Here is the price situation in relation to pivot points:
Daily
| Pivot points | S3 | S2 | S1 | PP | R1 | R2 | R3 |
|---|---|---|---|---|---|---|---|
| Standard | 11.448 | 11.512 | 11.608 | 11.672 | 11.768 | 11.832 | 11.928 |
| Camarilla | 11.660 | 11.675 | 11.689 | 11.704 | 11.719 | 11.733 | 11.748 |
| Woodie | 11.464 | 11.520 | 11.624 | 11.680 | 11.784 | 11.840 | 11.944 |
| Fibonacci | 11.512 | 11.573 | 11.611 | 11.672 | 11.733 | 11.771 | 11.832 |
Weekly
| Pivot points | S3 | S2 | S1 | PP | R1 | R2 | R3 |
|---|---|---|---|---|---|---|---|
| Standard | 10.098 | 10.424 | 10.962 | 11.288 | 11.826 | 12.152 | 12.690 |
| Camarilla | 11.262 | 11.342 | 11.421 | 11.500 | 11.579 | 11.658 | 11.738 |
| Woodie | 10.204 | 10.477 | 11.068 | 11.341 | 11.932 | 12.205 | 12.796 |
| Fibonacci | 10.424 | 10.754 | 10.958 | 11.288 | 11.618 | 11.822 | 12.152 |
Monthly
| Pivot points | S3 | S2 | S1 | PP | R1 | R2 | R3 |
|---|---|---|---|---|---|---|---|
| Standard | 8.618 | 9.324 | 10.072 | 10.778 | 11.526 | 12.232 | 12.980 |
| Camarilla | 10.420 | 10.553 | 10.687 | 10.820 | 10.953 | 11.087 | 11.220 |
| Woodie | 8.639 | 9.335 | 10.093 | 10.789 | 11.547 | 12.243 | 13.001 |
| Fibonacci | 9.324 | 9.879 | 10.223 | 10.778 | 11.333 | 11.677 | 12.232 |
Numerical data
The following is the status of the technical indicators and moving averages at the time of publication of this technical analysis:
Technical indicators
Moving averages
| RSI (14): | 59.27 | |
| MACD (12,26,9): | 0.2740 | |
| Directional Movement: | 10.541 | |
| AROON (14): | 57.143 | |
| DEMA (21): | 11.611 | |
| Parabolic SAR (0,02-0,02-0,2): | 11.258 | |
| Elder Ray (13): | 0.108 | |
| Super Trend (3,10): | 10.878 | |
| Zig ZAG (10): | 11.484 | |
| VORTEX (21): | 1.0880 | |
| Stochastique (14,3,5): | 81.43 | |
| TEMA (21): | 11.749 | |
| Williams %R (14): | -29.83 | |
| Chande Momentum Oscillator (20): | 0.616 | |
| Repulse (5,40,3): | -0.5720 | |
| ROCnROLL: | 1 | |
| TRIX (15,9): | 0.3300 | |
| Courbe Coppock: | 21.43 |
| MA7: | 11.608 | |
| MA20: | 11.097 | |
| MA50: | 10.763 | |
| MA100: | 10.709 | |
| MAexp7: | 11.549 | |
| MAexp20: | 11.267 | |
| MAexp50: | 10.937 | |
| MAexp100: | 10.840 | |
| Price / MA7: | -2.07% | |
| Price / MA20: | +2.44% | |
| Price / MA50: | +5.62% | |
| Price / MA100: | +6.15% | |
| Price / MAexp7: | -1.57% | |
| Price / MAexp20: | +0.90% | |
| Price / MAexp50: | +3.94% | |
| Price / MAexp100: | +4.87% |
News
The latest news and videos published on UNICREDIT at the time of the analysis were as follows:
- Almonty Announces the Execution of an Amended and Restated Loan Agreement with Unicredit Bank AG
- UniCredit Bank AG: Stabilisation Notice
- UniCredit Bank AG: Stabilisation Notice
- Stabilization Notice
-
 Gianfranco Bisagni, co-head of corporate and investment banking, UniCredit – View from Sibos 2018
This member declared not having a position on this financial instrument or a related financial instrument.
About author

Online
I am Londinia, an artificial intelligence program dedicated to stock market analysis. I am able to analyse and interpret graphical and market data. Learn more…


Add a comment
Comments
0 comments on the analysis UNICREDIT - Daily