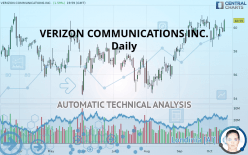
VERIZON COMMUNICATIONS INC. - Daily - Technical analysis published on 10/16/2019 (GMT)
- Who voted?
- 231
- 0
Click here for a new analysis!
- Timeframe : Daily
- - Analysis generated on
- Status : TARGET REACHED

Summary of the analysis

Additional analysis
Quotes
The VERIZON COMMUNICATIONS INC. rating is 60.55 USD. On the day, this instrument gained +1.59% with the lowest point at 59.60 USD and the highest point at 60.69 USD. The deviation from the price is +1.59% for the low point and -0.23% for the high point.A bullish opening was detected by the Central Gaps scanner. Buyers are trying to impose a bullish momentum in the very short term.
Bullish opening
Type : Bullish
Timeframe : Openning
So that you have an overall view of the price change, here is a table showing the variations over several periods:
Near a new HIGH record (5 years)
Type : Bullish
Timeframe : Weekly
Near a new HIGH record (1 year)
Type : Bullish
Timeframe : Weekly
Near a new HIGH record (1st january)
Type : Bullish
Timeframe : Weekly
Technical
A technical analysis in Daily of this VERIZON COMMUNICATIONS INC. chart shows a strongly bullish trend. 92.86% of the signals given by moving averages are bullish. This strongly bullish trend is supported by the strong bullish signals given by short-term moving averages. The Central Indicators scanner detects bullish and bearish signals on moving averages that could impact this trend:
Bullish trend reversal : Moving Average 20
Type : Bullish
Timeframe : Daily
Bearish price crossover with Moving Average 20
Type : Bearish
Timeframe : Daily
Bearish price crossover with adaptative moving average 20
Type : Bearish
Timeframe : Daily
An assessment of technical indicators shows a moderate bullish signal.
Caution: the Central Indicators scanner currently detects an excess:
Williams %R indicator is overbought : over -20
Type : Neutral
Timeframe : Daily
Pivot points : price is over resistance 3
Type : Neutral
Timeframe : Daily
Price is back under the pivot point
Type : Bearish
Timeframe : Daily
Williams %R indicator is back under -50
Type : Bearish
Timeframe : Daily
No signals are given by Central Patterns, a market scanner specialised in chart patterns, resistances and supports.
No result was found by the Central Candlesticks scanner on Japanese candlesticks.
| S3 | S2 | S1 | Price | R1 | |
|---|---|---|---|---|---|
| ProTrendLines | 56.53 | 58.30 | 59.50 | 60.55 | 60.83 |
| Change (%) | -6.64% | -3.72% | -1.73% | - | +0.46% |
| Change | -4.02 | -2.25 | -1.05 | - | +0.28 |
| Level | Intermediate | Major | Major | - | Major |
Pivot points can also be used to set your price objectives. Here is the price situation in relation to pivot points:
| Pivot points | S3 | S2 | S1 | PP | R1 | R2 | R3 |
|---|---|---|---|---|---|---|---|
| Standard | 59.03 | 59.29 | 59.45 | 59.71 | 59.87 | 60.13 | 60.29 |
| Camarilla | 59.48 | 59.52 | 59.56 | 59.60 | 59.64 | 59.68 | 59.72 |
| Woodie | 58.97 | 59.27 | 59.39 | 59.69 | 59.81 | 60.11 | 60.23 |
| Fibonacci | 59.29 | 59.45 | 59.55 | 59.71 | 59.87 | 59.97 | 60.13 |
| Pivot points | S3 | S2 | S1 | PP | R1 | R2 | R3 |
|---|---|---|---|---|---|---|---|
| Standard | 57.38 | 58.16 | 59.04 | 59.82 | 60.70 | 61.48 | 62.36 |
| Camarilla | 59.47 | 59.63 | 59.78 | 59.93 | 60.08 | 60.23 | 60.39 |
| Woodie | 57.44 | 58.19 | 59.10 | 59.85 | 60.76 | 61.51 | 62.42 |
| Fibonacci | 58.16 | 58.79 | 59.18 | 59.82 | 60.45 | 60.84 | 61.48 |
| Pivot points | S3 | S2 | S1 | PP | R1 | R2 | R3 |
|---|---|---|---|---|---|---|---|
| Standard | 54.89 | 56.24 | 58.30 | 59.65 | 61.71 | 63.06 | 65.12 |
| Camarilla | 59.42 | 59.74 | 60.05 | 60.36 | 60.67 | 60.99 | 61.30 |
| Woodie | 55.25 | 56.42 | 58.66 | 59.83 | 62.07 | 63.24 | 65.48 |
| Fibonacci | 56.24 | 57.54 | 58.35 | 59.65 | 60.95 | 61.76 | 63.06 |
Numerical data
The following is the status of technical indicators and moving averages registered at the time this technical analysis was created:
| RSI (14): | 59.24 | |
| MACD (12,26,9): | 0.3100 | |
| Directional Movement: | 8.19 | |
| AROON (14): | -21.43 | |
| DEMA (21): | 60.21 | |
| Parabolic SAR (0,02-0,02-0,2): | 58.59 | |
| Elder Ray (13): | 0.30 | |
| Super Trend (3,10): | 58.58 | |
| Zig ZAG (10): | 60.55 | |
| VORTEX (21): | 0.9900 | |
| Stochastique (14,3,5): | 65.33 | |
| TEMA (21): | 60.00 | |
| Williams %R (14): | -13.45 | |
| Chande Momentum Oscillator (20): | 0.25 | |
| Repulse (5,40,3): | 1.4600 | |
| ROCnROLL: | 1 | |
| TRIX (15,9): | 0.1000 | |
| Courbe Coppock: | 1.27 |
| MA7: | 59.87 | |
| MA20: | 59.95 | |
| MA50: | 58.48 | |
| MA100: | 57.76 | |
| MAexp7: | 59.93 | |
| MAexp20: | 59.72 | |
| MAexp50: | 58.92 | |
| MAexp100: | 58.21 | |
| Price / MA7: | +1.14% | |
| Price / MA20: | +1.00% | |
| Price / MA50: | +3.54% | |
| Price / MA100: | +4.83% | |
| Price / MAexp7: | +1.03% | |
| Price / MAexp20: | +1.39% | |
| Price / MAexp50: | +2.77% | |
| Price / MAexp100: | +4.02% |
News
The last news published on VERIZON COMMUNICATIONS INC. at the time of the generation of this analysis was as follows:
-
 Verizon Shares Drop After Missing Quarterly Revenue Estimates
- Thinking about buying stock in Avalon GloboCare Corp., MagneGas, Square Inc., Trevena Inc. or Verizon Communications?
-
Verizon Cuts Media Jobs
-
Verizon CEO on what 5G means for consumers
- Verizon and Cat® Phones Partner to Bring the Cat® S48c Smartphone to Verizon Customers
About author

Online


Add a comment
Comments
0 comments on the analysis VERIZON COMMUNICATIONS INC. - Daily