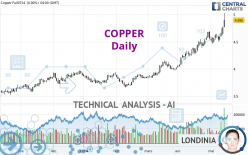
COPPER - Daily - Technical analysis published on 05/15/2024 (GMT)
- 61
- 0
Click here for a new analysis!
- Timeframe : Daily
- - Analysis generated on
- Status : INVALID

Summary of the analysis

Additional analysis
Quotes
The COPPER rating is 5.0595 USD. The price has increased by +3.36% since the last closing and was between 4.8910 USD and 5.0695 USD. This implies that the price is at +3.45% from its lowest and at -0.20% from its highest.The Central Gaps scanner detects a bullish opening. A small advantage for buyers in the very short term.
Bullish opening
Type : Bullish
Timeframe : Openning
So that you have an overall view of the price change, here is a table showing the variations over several periods:
Near a new HIGH record (5 years)
Type : Bullish
Timeframe : Weekly
New HIGH record (1 year)
Type : Bullish
Timeframe : Weekly
New HIGH record (1st january)
Type : Bullish
Timeframe : Weekly
New HIGH record (1 month)
Type : Bullish
Timeframe : Weekly
Technical
Technical analysis of this Daily chart of COPPER indicates that the overall trend is strongly bullish. 92.86% of the signals given by moving averages are bullish. The overall trend is supported by the strong bullish signals from short-term moving averages. The Central Indicators scanner does not detect any result on moving averages that would impact this trend.
An assessment of technical indicators shows a strong bullish signal.
Caution: the Central Indicators scanner currently detects an excess:
RSI indicator is overbought : over 70
Type : Neutral
Timeframe : Daily
CCI indicator is overbought : over 100
Type : Neutral
Timeframe : Daily
Previous candle closed over Bollinger bands
Type : Neutral
Timeframe : Daily
Williams %R indicator is overbought : over -20
Type : Neutral
Timeframe : Daily
Pivot points : price is over resistance 1
Type : Neutral
Timeframe : Daily
Pivot points : price is over resistance 2
Type : Neutral
Timeframe : Weekly
No signals are given by Central Patterns, a market scanner specialised in chart patterns, resistances and supports.
The Central Candlesticks scanner, specialised in Japanese candlesticks, did not identify any signals.
| S3 | S2 | S1 | Price | R1 | |
|---|---|---|---|---|---|
| ProTrendLines | 4.6765 | 4.7735 | 4.9430 | 5.0595 | 5.2078 |
| Change (%) | -7.57% | -5.65% | -2.30% | - | +2.93% |
| Change | -0.3830 | -0.2860 | -0.1165 | - | +0.1483 |
| Level | Intermediate | Intermediate | Intermediate | - | Intermediate |
Attention could also be paid to pivot points to set price objectives:
| Pivot points | S3 | S2 | S1 | PP | R1 | R2 | R3 |
|---|---|---|---|---|---|---|---|
| Standard | 4.5062 | 4.6363 | 4.7657 | 4.8958 | 5.0252 | 5.1553 | 5.2847 |
| Camarilla | 4.8236 | 4.8474 | 4.8712 | 4.8950 | 4.9188 | 4.9426 | 4.9664 |
| Woodie | 4.5058 | 4.6361 | 4.7653 | 4.8956 | 5.0248 | 5.1551 | 5.2843 |
| Fibonacci | 4.6363 | 4.7355 | 4.7967 | 4.8958 | 4.9950 | 5.0562 | 5.1553 |
| Pivot points | S3 | S2 | S1 | PP | R1 | R2 | R3 |
|---|---|---|---|---|---|---|---|
| Standard | 4.2893 | 4.3972 | 4.5298 | 4.6377 | 4.7703 | 4.8782 | 5.0108 |
| Camarilla | 4.5964 | 4.6184 | 4.6405 | 4.6625 | 4.6846 | 4.7066 | 4.7286 |
| Woodie | 4.3018 | 4.4034 | 4.5423 | 4.6439 | 4.7828 | 4.8844 | 5.0233 |
| Fibonacci | 4.3972 | 4.4890 | 4.5458 | 4.6377 | 4.7295 | 4.7863 | 4.8782 |
| Pivot points | S3 | S2 | S1 | PP | R1 | R2 | R3 |
|---|---|---|---|---|---|---|---|
| Standard | 3.5288 | 3.7917 | 4.1688 | 4.4317 | 4.8088 | 5.0717 | 5.4488 |
| Camarilla | 4.3700 | 4.4287 | 4.4873 | 4.5460 | 4.6047 | 4.6633 | 4.7220 |
| Woodie | 3.5860 | 3.8203 | 4.2260 | 4.4603 | 4.8660 | 5.1003 | 5.5060 |
| Fibonacci | 3.7917 | 4.0362 | 4.1872 | 4.4317 | 4.6762 | 4.8272 | 5.0717 |
Numerical data
The following is the status of the technical indicators and moving averages at the time of publication of this technical analysis:
| RSI (14): | 79.12 | |
| MACD (12,26,9): | 0.1514 | |
| Directional Movement: | 30.7382 | |
| AROON (14): | 100.0000 | |
| DEMA (21): | 4.7943 | |
| Parabolic SAR (0,02-0,02-0,2): | 4.5163 | |
| Elder Ray (13): | 0.2937 | |
| Super Trend (3,10): | 4.5903 | |
| Zig ZAG (10): | 5.0585 | |
| VORTEX (21): | 1.2274 | |
| Stochastique (14,3,5): | 90.71 | |
| TEMA (21): | 4.8372 | |
| Williams %R (14): | -2.07 | |
| Chande Momentum Oscillator (20): | 0.3395 | |
| Repulse (5,40,3): | 7.0479 | |
| ROCnROLL: | 1 | |
| TRIX (15,9): | 0.4063 | |
| Courbe Coppock: | 11.23 |
| MA7: | 4.7307 | |
| MA20: | 4.6007 | |
| MA50: | 4.3140 | |
| MA100: | 4.0809 | |
| MAexp7: | 4.7896 | |
| MAexp20: | 4.6050 | |
| MAexp50: | 4.3773 | |
| MAexp100: | 4.1876 | |
| Price / MA7: | +6.95% | |
| Price / MA20: | +9.97% | |
| Price / MA50: | +17.28% | |
| Price / MA100: | +23.98% | |
| Price / MAexp7: | +5.64% | |
| Price / MAexp20: | +9.87% | |
| Price / MAexp50: | +15.58% | |
| Price / MAexp100: | +20.82% |
News
The last news published on COPPER at the time of the generation of this analysis was as follows:
-
 Sweden's Sámi pay the price in Europe's quest for copper
-
Why Glencore have joined the bidding war to buy Anglo American. #copper #Glencore #trading
-
What does BHP’s deal to buy Anglo American mean for the mining and London markets? #Mining #Copper
-
‘Copper likely to stay above $9,000‘ – Meyer
-
Inflation sends cocoa prices through the roof, more expensive than copper
About author

Online


Add a comment
Comments
0 comments on the analysis COPPER - Daily