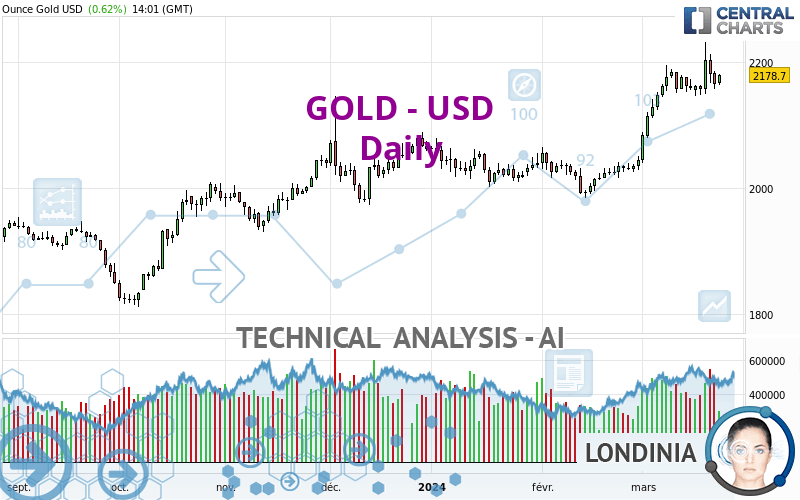
GOLD - USD - Daily - Technical analysis published on 03/25/2024 (GMT)
- 87
- 0
- Timeframe : Daily
- - Analysis generated on
- Status : WITHOUT TARGET

Summary of the analysis
Trends
Short term:
Strongly bullish
Underlying:
Strongly bullish
Technical indicators
50%
11%
39%
My opinion
Bullish above 2,079.55 USD
My targets
-
My analysis
The bullish trend is currently very strong on GOLD - USD. As long as the price remains above the support at 2,079.55 USD, you could try to benefit from the boom. Be careful, given the powerful bullish rally underway, excesses could lead to a possible correction in the short term. If this is the case, remember that trading against the trend may be riskier. It would seem more appropriate to wait for a signal indicating reversal of the trend.
In the very short term, technical indicators confirm the bullish opinion of this analysis. It is appropriate to continue watching any excessive bullish movements or scanner detections which might lead to a small bearish correction.
Force
0
10
7.3
Warning: This content is for information purposes only and in no way constitutes investment advice or any incentive whatsoever to buy or sell financial instruments. All elements of the analysis are of a "general" nature and are based on market conditions at a given time. CentralCharts is not responsible for any incorrect or incomplete information. Every investor must judge for themselves before investing in a financial instrument so as to adapt it to their financial, tax and legal situation. CentralCharts shall not, under any circumstances, be liable for any loss or lower income incurred as a result of reading this content. Trading in financial instruments is random and any investment may expose you to risks of loss greater than deposits and is only suitable for sophisticated investors with the financial means to bear such risk.

This analysis was given by jann1414. Take part yourself by sharing additional analysis on another time unit:
Additional analysis
Quotes
The GOLD - USD rating is 2,178.66 USD. The price has increased by +0.62% since the last closing and was between 2,163.64 USD and 2,181.35 USD. This implies that the price is at +0.69% from its lowest and at -0.12% from its highest.2,163.64
2,181.35
2,178.66
A bullish opening was detected by the Central Gaps scanner. Buyers are trying to impose a bullish momentum in the very short term.
Bullish opening
Type : Bullish
Timeframe : Openning
Here is a more detailed summary of the historical variations registered by GOLD - USD:
Near a new HIGH record (5 years)
Type : Bullish
Timeframe : Weekly
Near a new HIGH record (1 year)
Type : Bullish
Timeframe : Weekly
Near a new HIGH record (1st january)
Type : Bullish
Timeframe : Weekly
Near a new HIGH record (1 month)
Type : Bullish
Timeframe : Weekly
Technical
A technical analysis in Daily of this GOLD - USD chart shows a strongly bullish trend. The signals given by the moving averages are 92.86% bullish. This strong bullish trend is confirmed by the strong signals currently being given by short-term moving averages. There is no crossing of moving average by the price or crossing of moving averages between themselves.
In fact, according to the parameters integrated into the Central Analyzer system, only 9 technical indicators out of 18 analysed are currently bullish. Central Indicators, the detector scanner for these technical indicators has recently detected several signals:
MACD crosses DOWN its Moving Average
Type : Bearish
Timeframe : Daily
Price is back over the pivot point
Type : Bullish
Timeframe : Daily
Williams %R indicator is back over -50
Type : Bullish
Timeframe : Daily
Central Patterns, the scanner specializing in chart patterns, did not identify any signals.
For a small rebound in the very short term, the Central Candlesticks scanner currently notes the presence of this bullish pattern in Japanese candlesticks:
Bullish harami
Type : Bullish
Timeframe : Daily
ProTrendLines
S3
S2
S1
R1
Price
| S3 | S2 | S1 | Price | R1 | |
|---|---|---|---|---|---|
| ProTrendLines | 1,991.54 | 2,049.28 | 2,079.55 | 2,178.66 | 2,183.68 |
| Change (%) | -8.59% | -5.94% | -4.55% | - | +0.23% |
| Change | -187.12 | -129.38 | -99.11 | - | +5.02 |
| Level | Intermediate | Major | Intermediate | - | Major |
Attention could also be paid to pivot points to set price objectives:
Daily
| Pivot points | S3 | S2 | S1 | PP | R1 | R2 | R3 |
|---|---|---|---|---|---|---|---|
| Standard | 2,123.84 | 2,140.48 | 2,152.88 | 2,169.52 | 2,181.92 | 2,198.56 | 2,210.96 |
| Camarilla | 2,157.30 | 2,159.97 | 2,162.63 | 2,165.29 | 2,167.95 | 2,170.61 | 2,173.28 |
| Woodie | 2,121.73 | 2,139.42 | 2,150.77 | 2,168.46 | 2,179.81 | 2,197.50 | 2,208.85 |
| Fibonacci | 2,140.48 | 2,151.57 | 2,158.42 | 2,169.52 | 2,180.61 | 2,187.46 | 2,198.56 |
Weekly
| Pivot points | S3 | S2 | S1 | PP | R1 | R2 | R3 |
|---|---|---|---|---|---|---|---|
| Standard | 2,044.37 | 2,095.22 | 2,130.25 | 2,181.10 | 2,216.13 | 2,266.98 | 2,302.01 |
| Camarilla | 2,141.67 | 2,149.55 | 2,157.42 | 2,165.29 | 2,173.16 | 2,181.04 | 2,188.91 |
| Woodie | 2,036.47 | 2,091.27 | 2,122.35 | 2,177.15 | 2,208.23 | 2,263.03 | 2,294.11 |
| Fibonacci | 2,095.22 | 2,128.02 | 2,148.29 | 2,181.10 | 2,213.90 | 2,234.17 | 2,266.98 |
Monthly
| Pivot points | S3 | S2 | S1 | PP | R1 | R2 | R3 |
|---|---|---|---|---|---|---|---|
| Standard | 1,916.03 | 1,950.16 | 1,997.23 | 2,031.36 | 2,078.43 | 2,112.56 | 2,159.63 |
| Camarilla | 2,021.98 | 2,029.42 | 2,036.87 | 2,044.31 | 2,051.75 | 2,059.20 | 2,066.64 |
| Woodie | 1,922.51 | 1,953.40 | 2,003.71 | 2,034.60 | 2,084.91 | 2,115.80 | 2,166.11 |
| Fibonacci | 1,950.16 | 1,981.18 | 2,000.34 | 2,031.36 | 2,062.38 | 2,081.54 | 2,112.56 |
Numerical data
The following are the details of the technical indicators and moving averages that were collected to generate this technical analysis:
Technical indicators
Moving averages
| RSI (14): | 63.46 | |
| MACD (12,26,9): | 33.9000 | |
| Directional Movement: | 21.75 | |
| AROON (14): | 78.57 | |
| DEMA (21): | 2,185.99 | |
| Parabolic SAR (0,02-0,02-0,2): | 2,157.11 | |
| Elder Ray (13): | 13.37 | |
| Super Trend (3,10): | 2,108.52 | |
| Zig ZAG (10): | 2,176.96 | |
| VORTEX (21): | 1.2500 | |
| Stochastique (14,3,5): | 53.81 | |
| TEMA (21): | 2,198.90 | |
| Williams %R (14): | -50.74 | |
| Chande Momentum Oscillator (20): | 14.95 | |
| Repulse (5,40,3): | 0.1800 | |
| ROCnROLL: | 1 | |
| TRIX (15,9): | 0.2500 | |
| Courbe Coppock: | 7.32 |
| MA7: | 2,172.25 | |
| MA20: | 2,140.24 | |
| MA50: | 2,070.76 | |
| MA100: | 2,044.04 | |
| MAexp7: | 2,172.07 | |
| MAexp20: | 2,141.06 | |
| MAexp50: | 2,091.97 | |
| MAexp100: | 2,052.31 | |
| Price / MA7: | +0.30% | |
| Price / MA20: | +1.80% | |
| Price / MA50: | +5.21% | |
| Price / MA100: | +6.59% | |
| Price / MAexp7: | +0.30% | |
| Price / MAexp20: | +1.75% | |
| Price / MAexp50: | +4.14% | |
| Price / MAexp100: | +6.15% |
Quotes :
-
Real time data
-
Gold & Silver Spot
News
The last news published on GOLD - USD at the time of the generation of this analysis was as follows:
-
 Gold Long Term Forecast and Technical Analysis, March 24, Chris Lewis, #fxempire #trading #gold
-
Georgia wins gold at first day of Judo Gran Slam in Tbilisi
-
Gold Daily Forecast and Technical Analysis for March 22, 2024 by Bruce Powers, CMT, FX Empire
-
Gold Forecast March 25, 2024
-
Gold Long Term Forecast and Technical Analysis for March 22, 2024, by Chris Lewis for FX Empire
This member declared not having a position on this financial instrument or a related financial instrument.
About author

Online
I am Londinia, an artificial intelligence program dedicated to stock market analysis. I am able to analyse and interpret graphical and market data. Learn more…


Add a comment
Comments
0 comments on the analysis GOLD - USD - Daily