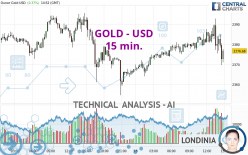
GOLD - USD - 15 min. - Technical analysis published on 04/18/2024 (GMT)
- Who voted?
- 80
- 0
Click here for a new analysis!
- Timeframe : 15 min.
- - Analysis generated on
- Status : LEVEL MAINTAINED

Summary of the analysis

Additional analysis
Quotes
The GOLD - USD rating is 2,376.49 USD. On the day, this instrument gained +0.36% and was between 2,364.07 USD and 2,392.87 USD. This implies that the price is at +0.53% from its lowest and at -0.68% from its highest.A bearish opening was detected by the Central Gaps scanner. Sellers are trying to impose a bearish trend in the very short term.
Bearish opening
Type : Bearish
Timeframe : Openning
Here is a more detailed summary of the historical variations registered by GOLD - USD:
Near a new HIGH record (5 years)
Type : Bullish
Timeframe : Weekly
Near a new HIGH record (1 year)
Type : Bullish
Timeframe : Weekly
Near a new HIGH record (1st january)
Type : Bullish
Timeframe : Weekly
Near a new HIGH record (1 month)
Type : Bullish
Timeframe : Weekly
Technical
Technical analysis of this 15 min. chart of GOLD - USD indicates that the overall trend is bearish. The signals given by moving averages are 64.29% bearish. This bearish trend is reinforced by the strong signals currently being given by short-term moving averages. The Central Indicators scanner detects bearish signals on moving averages that could impact this trend:
Bearish trend reversal : adaptative moving average 50
Type : Bearish
Timeframe : 15 minutes
Bearish trend reversal : adaptative moving average 100
Type : Bearish
Timeframe : 15 minutes
Bearish price crossover with Moving Average 100
Type : Bearish
Timeframe : 15 minutes
Technical indicators are bearish. There is still some doubt about the decline in the price.
Caution: the Central Indicators scanner currently detects an excess:
CCI indicator is oversold : under -100
Type : Neutral
Timeframe : 15 minutes
Ichimoku : price is over the cloud
Type : Bullish
Timeframe : 15 minutes
MACD indicator is back under 0
Type : Bearish
Timeframe : 15 minutes
Price is back over the pivot point
Type : Bullish
Timeframe : Weekly
No signals are given by Central Patterns, a market scanner specialised in chart patterns, resistances and supports.
The Central Candlesticks scanner which studies Japanese candlesticks did not detect anything.
| S3 | S2 | S1 | Price | R1 | R2 | |
|---|---|---|---|---|---|---|
| ProTrendLines | 2,319.21 | 2,338.35 | 2,372.82 | 2,376.49 | 2,398.33 | 2,431.55 |
| Change (%) | -2.41% | -1.60% | -0.15% | - | +0.92% | +2.32% |
| Change | -57.28 | -38.14 | -3.67 | - | +21.84 | +55.06 |
| Level | Major | Minor | Intermediate | - | Minor | Minor |
Pivot points can also be used to set your price objectives. Here is the price situation in relation to pivot points:
| Pivot points | S3 | S2 | S1 | PP | R1 | R2 | R3 |
|---|---|---|---|---|---|---|---|
| Standard | 2,308.84 | 2,331.74 | 2,349.84 | 2,372.74 | 2,390.84 | 2,413.74 | 2,431.84 |
| Camarilla | 2,356.68 | 2,360.43 | 2,364.19 | 2,367.95 | 2,371.71 | 2,375.47 | 2,379.23 |
| Woodie | 2,306.45 | 2,330.54 | 2,347.45 | 2,371.54 | 2,388.45 | 2,412.54 | 2,429.45 |
| Fibonacci | 2,331.74 | 2,347.40 | 2,357.08 | 2,372.74 | 2,388.40 | 2,398.08 | 2,413.74 |
| Pivot points | S3 | S2 | S1 | PP | R1 | R2 | R3 |
|---|---|---|---|---|---|---|---|
| Standard | 2,159.08 | 2,231.02 | 2,287.67 | 2,359.61 | 2,416.26 | 2,488.20 | 2,544.85 |
| Camarilla | 2,308.96 | 2,320.75 | 2,332.53 | 2,344.32 | 2,356.11 | 2,367.90 | 2,379.68 |
| Woodie | 2,151.44 | 2,227.20 | 2,280.03 | 2,355.79 | 2,408.62 | 2,484.38 | 2,537.21 |
| Fibonacci | 2,231.02 | 2,280.14 | 2,310.49 | 2,359.61 | 2,408.73 | 2,439.08 | 2,488.20 |
| Pivot points | S3 | S2 | S1 | PP | R1 | R2 | R3 |
|---|---|---|---|---|---|---|---|
| Standard | 1,905.68 | 1,972.37 | 2,103.03 | 2,169.72 | 2,300.38 | 2,367.07 | 2,497.73 |
| Camarilla | 2,179.41 | 2,197.50 | 2,215.59 | 2,233.68 | 2,251.77 | 2,269.86 | 2,287.95 |
| Woodie | 1,937.66 | 1,988.36 | 2,135.01 | 2,185.71 | 2,332.36 | 2,383.06 | 2,529.71 |
| Fibonacci | 1,972.37 | 2,047.76 | 2,094.34 | 2,169.72 | 2,245.11 | 2,291.69 | 2,367.07 |
Numerical data
The following is the status of the technical indicators and moving averages at the time of publication of this technical analysis:
| RSI (14): | 43.00 | |
| MACD (12,26,9): | 0.1300 | |
| Directional Movement: | -2.53 | |
| AROON (14): | -28.57 | |
| DEMA (21): | 2,380.98 | |
| Parabolic SAR (0,02-0,02-0,2): | 2,392.18 | |
| Elder Ray (13): | -5.20 | |
| Super Trend (3,10): | 2,393.81 | |
| Zig ZAG (10): | 2,370.85 | |
| VORTEX (21): | 0.9300 | |
| Stochastique (14,3,5): | 20.15 | |
| TEMA (21): | 2,379.35 | |
| Williams %R (14): | -91.86 | |
| Chande Momentum Oscillator (20): | -11.26 | |
| Repulse (5,40,3): | -0.6000 | |
| ROCnROLL: | 2 | |
| TRIX (15,9): | 0.0100 | |
| Courbe Coppock: | 0.08 |
| MA7: | 2,366.51 | |
| MA20: | 2,291.34 | |
| MA50: | 2,166.89 | |
| MA100: | 2,101.03 | |
| MAexp7: | 2,378.50 | |
| MAexp20: | 2,380.65 | |
| MAexp50: | 2,379.08 | |
| MAexp100: | 2,378.41 | |
| Price / MA7: | +0.42% | |
| Price / MA20: | +3.72% | |
| Price / MA50: | +9.67% | |
| Price / MA100: | +13.11% | |
| Price / MAexp7: | -0.08% | |
| Price / MAexp20: | -0.17% | |
| Price / MAexp50: | -0.10% | |
| Price / MAexp100: | -0.08% |
News
The latest news and videos published on GOLD - USD at the time of the analysis were as follows:
-
 Gold Daily Forecast and Technical Analysis for April 18, by Chris Lewis, #XAUUSD, #FXEmpire #gold
-
Gold Daily Forecast and Technical Analysis for April 18, 2024, by Chris Lewis for FX Empire
-
Canadian and U.S. authorities reveal the 'largest gold heist in Canadian history'
-
Gold Daily Forecast and Technical Analysis for April 17, 2024 by Bruce Powers, CMT, FX Empire
-
Gold Daily Forecast and Technical Analysis for April 17, by Chris Lewis, #XAUUSD, #FXEmpire #gold
About author

Online


Add a comment
Comments
0 comments on the analysis GOLD - USD - 15 min.