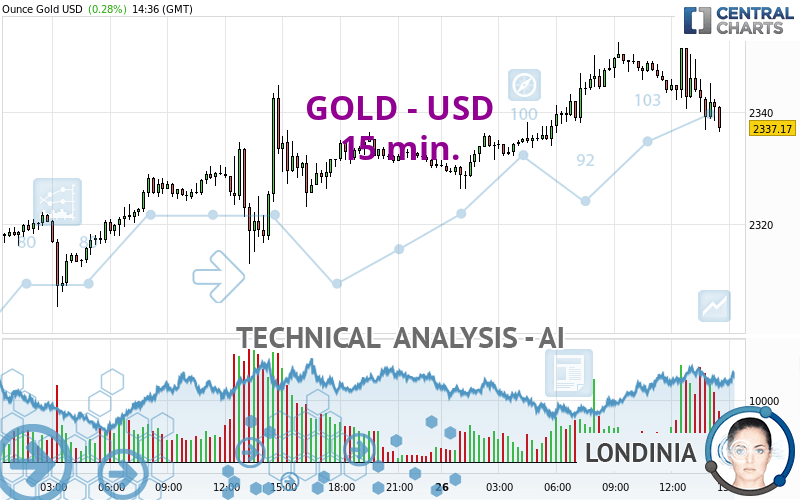
GOLD - USD - 15 min. - Technical analysis published on 04/26/2024 (GMT)
- 89
- 0
Click here for a new analysis!
- Timeframe : 15 min.
- - Analysis generated on
- Status : LEVEL MAINTAINED

Summary of the analysis

Additional analysis
Quotes
The GOLD - USD rating is 2,337.17 USD. The price registered an increase of +0.28% on the session and was between 2,326.29 USD and 2,352.61 USD. This implies that the price is at +0.47% from its lowest and at -0.66% from its highest.The Central Gaps scanner detects a bullish opening. A small advantage for buyers in the very short term.
Bullish opening
Type : Bullish
Timeframe : Openning
Here is a more detailed summary of the historical variations registered by GOLD - USD:
Near a new HIGH record (5 years)
Type : Bullish
Timeframe : Weekly
Near a new HIGH record (1 year)
Type : Bullish
Timeframe : Weekly
Near a new HIGH record (1st january)
Type : Bullish
Timeframe : Weekly
Near a new HIGH record (1 month)
Type : Bullish
Timeframe : Weekly
Technical
Technical analysis of GOLD - USD in 15 min. shows an overall slightly bullish trend. 60.71% of the signals given by moving averages are bullish. Caution: the strong bearish signals currently given by short-term moving averages indicate that a trend reversal may be taking place. The Central Indicators scanner detects a bullish signal on moving averages that could impact this trend:
Bullish price crossover with Moving Average 50
Type : Bullish
Timeframe : 15 minutes
In fact, Central Analyzer took into account 18 technical indicators and the result was as follows: 4 are bullish, 8 are neutral and 6 are bearish. But beware of excesses. The Central Indicators scanner currently detects this:
CCI indicator is oversold : under -100
Type : Neutral
Timeframe : 15 minutes
Williams %R indicator is oversold : under -80
Type : Neutral
Timeframe : 15 minutes
Price is back under the pivot point
Type : Bearish
Timeframe : Weekly
The analysis of the price chart with Central Patterns scanners does not return any result.
From the Japanese candlestick perspective, the Central Candlesticks scanner notes the presence of these results that could impact the short-term trend:
Bearish harami
Type : Bearish
Timeframe : 15 minutes
Doji
Type : Neutral
Timeframe : 15 minutes
Bearish harami cross
Type : Bearish
Timeframe : 15 minutes
| S3 | S2 | S1 | Price | R1 | R2 | R3 | |
|---|---|---|---|---|---|---|---|
| ProTrendLines | 2,312.53 | 2,324.62 | 2,336.78 | 2,337.17 | 2,373.14 | 2,398.33 | 2,417.91 |
| Change (%) | -1.05% | -0.54% | -0.02% | - | +1.54% | +2.62% | +3.45% |
| Change | -24.64 | -12.55 | -0.39 | - | +35.97 | +61.16 | +80.74 |
| Level | Major | Minor | Intermediate | - | Intermediate | Minor | Minor |
Pivot points can also be used to set your price objectives. Here is the price situation in relation to pivot points:
| Pivot points | S3 | S2 | S1 | PP | R1 | R2 | R3 |
|---|---|---|---|---|---|---|---|
| Standard | 2,269.16 | 2,287.17 | 2,308.91 | 2,326.92 | 2,348.66 | 2,366.67 | 2,388.41 |
| Camarilla | 2,319.73 | 2,323.37 | 2,327.02 | 2,330.66 | 2,334.30 | 2,337.95 | 2,341.59 |
| Woodie | 2,271.04 | 2,288.10 | 2,310.79 | 2,327.85 | 2,350.54 | 2,367.60 | 2,390.29 |
| Fibonacci | 2,287.17 | 2,302.35 | 2,311.73 | 2,326.92 | 2,342.10 | 2,351.48 | 2,366.67 |
| Pivot points | S3 | S2 | S1 | PP | R1 | R2 | R3 |
|---|---|---|---|---|---|---|---|
| Standard | 2,245.34 | 2,285.41 | 2,337.77 | 2,377.84 | 2,430.20 | 2,470.27 | 2,522.63 |
| Camarilla | 2,364.71 | 2,373.19 | 2,381.66 | 2,390.13 | 2,398.60 | 2,407.08 | 2,415.55 |
| Woodie | 2,251.49 | 2,288.48 | 2,343.92 | 2,380.91 | 2,436.35 | 2,473.34 | 2,528.78 |
| Fibonacci | 2,285.41 | 2,320.72 | 2,342.53 | 2,377.84 | 2,413.15 | 2,434.96 | 2,470.27 |
| Pivot points | S3 | S2 | S1 | PP | R1 | R2 | R3 |
|---|---|---|---|---|---|---|---|
| Standard | 1,905.68 | 1,972.37 | 2,103.03 | 2,169.72 | 2,300.38 | 2,367.07 | 2,497.73 |
| Camarilla | 2,179.41 | 2,197.50 | 2,215.59 | 2,233.68 | 2,251.77 | 2,269.86 | 2,287.95 |
| Woodie | 1,937.66 | 1,988.36 | 2,135.01 | 2,185.71 | 2,332.36 | 2,383.06 | 2,529.71 |
| Fibonacci | 1,972.37 | 2,047.76 | 2,094.34 | 2,169.72 | 2,245.11 | 2,291.69 | 2,367.07 |
Numerical data
The following is the status of the technical indicators and moving averages at the time of publication of this technical analysis:
| RSI (14): | 49.30 | |
| MACD (12,26,9): | -0.1000 | |
| Directional Movement: | 0.66 | |
| AROON (14): | -35.72 | |
| DEMA (21): | 2,344.62 | |
| Parabolic SAR (0,02-0,02-0,2): | 2,349.84 | |
| Elder Ray (13): | -0.83 | |
| Super Trend (3,10): | 2,352.59 | |
| Zig ZAG (10): | 2,341.66 | |
| VORTEX (21): | 0.9400 | |
| Stochastique (14,3,5): | 16.67 | |
| TEMA (21): | 2,341.67 | |
| Williams %R (14): | -81.01 | |
| Chande Momentum Oscillator (20): | -7.16 | |
| Repulse (5,40,3): | -0.2000 | |
| ROCnROLL: | 2 | |
| TRIX (15,9): | 0.0100 | |
| Courbe Coppock: | 0.44 |
| MA7: | 2,344.87 | |
| MA20: | 2,336.92 | |
| MA50: | 2,206.32 | |
| MA100: | 2,118.89 | |
| MAexp7: | 2,342.04 | |
| MAexp20: | 2,344.30 | |
| MAexp50: | 2,341.79 | |
| MAexp100: | 2,337.17 | |
| Price / MA7: | -0.33% | |
| Price / MA20: | +0.01% | |
| Price / MA50: | +5.93% | |
| Price / MA100: | +10.30% | |
| Price / MAexp7: | -0.21% | |
| Price / MAexp20: | -0.30% | |
| Price / MAexp50: | -0.20% | |
| Price / MAexp100: | +0.00% |
News
The last news published on GOLD - USD at the time of the generation of this analysis was as follows:
-
 Gold Long Term Forecast and Technical Analysis for April 26, 2024, by Chris Lewis for FX Empire
-
Gold Daily Forecast and Technical Analysis for April 26, 2024, by Chris Lewis for FX Empire
-
Gold Daily Forecast and Technical Analysis for April 25, 2024 by Bruce Powers, CMT, FX Empire
-
Navigating Gold Investment with Ion-Marc Valahu
-
Gold Daily Forecast and Technical Analysis for April 25 by Chris Lewis, #XAUUSD, #FXEmpire #gold
About author

Online


Add a comment
Comments
0 comments on the analysis GOLD - USD - 15 min.