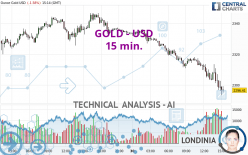
GOLD - USD - 15 min. - Technical analysis published on 04/30/2024 (GMT)
- 108
- 0
Click here for a new analysis!
- Timeframe : 15 min.
- - Analysis generated on
- Status : TARGET REACHED

Summary of the analysis

Additional analysis
Quotes
The GOLD - USD price is 2,296.42 USD. The price registered a decrease of -1.58% on the session and was traded between 2,293.26 USD and 2,336.22 USD over the period. The price is currently at +0.14% from its lowest and -1.70% from its highest.The Central Gaps scanner detects a bullish opening. A small advantage for buyers in the very short term.
Bullish opening
Type : Bullish
Timeframe : Openning
Here is a more detailed summary of the historical variations registered by GOLD - USD:
Near a new HIGH record (5 years)
Type : Bullish
Timeframe : Weekly
Near a new HIGH record (1 year)
Type : Bullish
Timeframe : Weekly
Near a new HIGH record (1st january)
Type : Bullish
Timeframe : Weekly
Near a new HIGH record (1 month)
Type : Bullish
Timeframe : Weekly
Technical
A technical analysis in 15 min. of this GOLD - USD chart shows a sharp bearish trend. 92.86% of the signals given by moving averages are bearish. This strongly bearish trend is supported by the strong bearish signals given by short-term moving averages. The Central Indicators scanner does not detect any result on moving averages that would impact this trend.
Technical indicators are strongly bearish, suggesting that the price decline is expected to continue.
Caution: the Central Indicators scanner currently detects an excess:
RSI indicator is oversold : under 30
Type : Neutral
Timeframe : 15 minutes
CCI indicator is oversold : under -100
Type : Neutral
Timeframe : 15 minutes
CCI indicator: bullish divergence
Type : Bullish
Timeframe : 15 minutes
RSI indicator: bullish divergence
Type : Bullish
Timeframe : 15 minutes
Williams %R indicator is oversold : under -80
Type : Neutral
Timeframe : 15 minutes
Pivot points : price is under support 3
Type : Neutral
Timeframe : 15 minutes
Central Patterns, the scanner specializing in chart patterns, did not identify any signals.
No result was found by the Central Candlesticks scanner on Japanese candlesticks.
| S3 | S2 | S1 | Price | R1 | R2 | R3 | |
|---|---|---|---|---|---|---|---|
| ProTrendLines | 2,049.28 | 2,157.06 | 2,291.48 | 2,296.42 | 2,305.17 | 2,325.35 | 2,353.01 |
| Change (%) | -10.76% | -6.07% | -0.22% | - | +0.38% | +1.26% | +2.46% |
| Change | -247.14 | -139.36 | -4.94 | - | +8.75 | +28.93 | +56.59 |
| Level | Major | Minor | Minor | - | Minor | Intermediate | Intermediate |
To determine price objectives, it is also possible to use the pivot points. Here is the price position in relation to pivot points:
| Pivot points | S3 | S2 | S1 | PP | R1 | R2 | R3 |
|---|---|---|---|---|---|---|---|
| Standard | 2,293.11 | 2,306.56 | 2,319.87 | 2,333.32 | 2,346.63 | 2,360.08 | 2,373.39 |
| Camarilla | 2,325.83 | 2,328.28 | 2,330.74 | 2,333.19 | 2,335.64 | 2,338.10 | 2,340.55 |
| Woodie | 2,293.05 | 2,306.53 | 2,319.81 | 2,333.29 | 2,346.57 | 2,360.05 | 2,373.33 |
| Fibonacci | 2,306.56 | 2,316.78 | 2,323.09 | 2,333.32 | 2,343.54 | 2,349.85 | 2,360.08 |
| Pivot points | S3 | S2 | S1 | PP | R1 | R2 | R3 |
|---|---|---|---|---|---|---|---|
| Standard | 2,187.28 | 2,239.38 | 2,287.70 | 2,339.80 | 2,388.12 | 2,440.22 | 2,488.54 |
| Camarilla | 2,308.41 | 2,317.61 | 2,326.82 | 2,336.02 | 2,345.23 | 2,354.43 | 2,363.64 |
| Woodie | 2,185.39 | 2,238.44 | 2,285.81 | 2,338.86 | 2,386.23 | 2,439.28 | 2,486.65 |
| Fibonacci | 2,239.38 | 2,277.74 | 2,301.44 | 2,339.80 | 2,378.16 | 2,401.86 | 2,440.22 |
| Pivot points | S3 | S2 | S1 | PP | R1 | R2 | R3 |
|---|---|---|---|---|---|---|---|
| Standard | 1,905.68 | 1,972.37 | 2,103.03 | 2,169.72 | 2,300.38 | 2,367.07 | 2,497.73 |
| Camarilla | 2,179.41 | 2,197.50 | 2,215.59 | 2,233.68 | 2,251.77 | 2,269.86 | 2,287.95 |
| Woodie | 1,937.66 | 1,988.36 | 2,135.01 | 2,185.71 | 2,332.36 | 2,383.06 | 2,529.71 |
| Fibonacci | 1,972.37 | 2,047.76 | 2,094.34 | 2,169.72 | 2,245.11 | 2,291.69 | 2,367.07 |
Numerical data
The following is the status of the technical indicators and moving averages at the time of publication of this technical analysis:
| RSI (14): | 28.31 | |
| MACD (12,26,9): | -5.4900 | |
| Directional Movement: | -20.89 | |
| AROON (14): | -100.00 | |
| DEMA (21): | 2,299.39 | |
| Parabolic SAR (0,02-0,02-0,2): | 2,311.25 | |
| Elder Ray (13): | -7.12 | |
| Super Trend (3,10): | 2,313.37 | |
| Zig ZAG (10): | 2,296.41 | |
| VORTEX (21): | 0.7900 | |
| Stochastique (14,3,5): | 8.38 | |
| TEMA (21): | 2,297.39 | |
| Williams %R (14): | -88.58 | |
| Chande Momentum Oscillator (20): | -16.94 | |
| Repulse (5,40,3): | -0.4100 | |
| ROCnROLL: | 2 | |
| TRIX (15,9): | -0.0300 | |
| Courbe Coppock: | 1.18 |
| MA7: | 2,324.14 | |
| MA20: | 2,341.75 | |
| MA50: | 2,218.21 | |
| MA100: | 2,124.58 | |
| MAexp7: | 2,299.70 | |
| MAexp20: | 2,306.28 | |
| MAexp50: | 2,314.53 | |
| MAexp100: | 2,321.81 | |
| Price / MA7: | -1.19% | |
| Price / MA20: | -1.94% | |
| Price / MA50: | +3.53% | |
| Price / MA100: | +8.09% | |
| Price / MAexp7: | -0.14% | |
| Price / MAexp20: | -0.43% | |
| Price / MAexp50: | -0.78% | |
| Price / MAexp100: | -1.09% |
News
The latest news and videos published on GOLD - USD at the time of the analysis were as follows:
-
 Avino Silver & Gold Mines – executive interview
-
Gold Forecast May 1, 2024
-
Gold Daily Forecast and Technical Analysis for April 30, 2024, by Chris Lewis for FX Empire
-
Gold Daily Forecast and Technical Analysis for April 29, 2024 by Bruce Powers, CMT, FX Empire
-
Gold Forecast April 30, 2024
About author

Online


Add a comment
Comments
0 comments on the analysis GOLD - USD - 15 min.