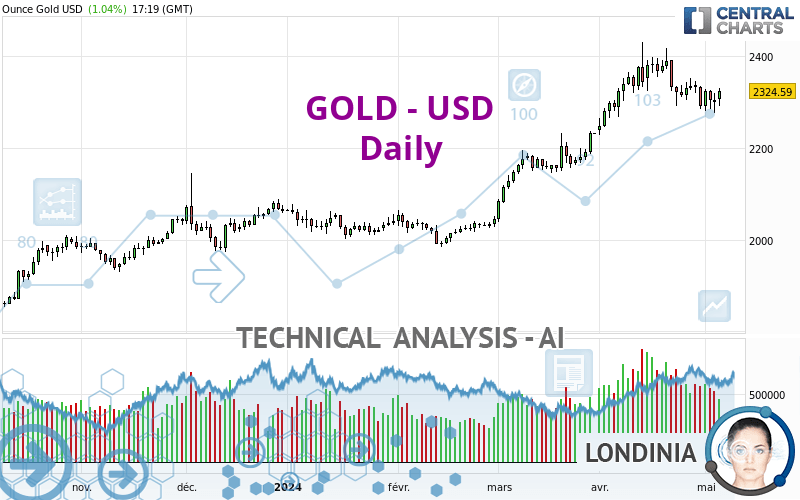
GOLD - USD - Daily - Technical analysis published on 05/06/2024 (GMT)
- 90
- 0
Click here for a new analysis!
- Timeframe : Daily
- - Analysis generated on
- Status : TARGET REACHED

Summary of the analysis

Additional analysis
Quotes
The GOLD - USD rating is 2,324.58 USD. The price has increased by +1.04% since the last closing and was traded between 2,291.86 USD and 2,332.02 USD over the period. The price is currently at +1.43% from its lowest and -0.32% from its highest.The Central Gaps scanner detects a bullish opening marking the presence of buyers ahead of sellers at the opening but not sufficiently marked to allow the price to register a quotation gap.
Bullish opening
Type : Bullish
Timeframe : Openning
Here is a more detailed summary of the historical variations registered by GOLD - USD:
Near a new HIGH record (5 years)
Type : Bullish
Timeframe : Weekly
Near a new HIGH record (1 year)
Type : Bullish
Timeframe : Weekly
Near a new HIGH record (1st january)
Type : Bullish
Timeframe : Weekly
Near a new HIGH record (1 month)
Type : Bullish
Timeframe : Weekly
Technical
Technical analysis of GOLD - USD in Daily shows a strongly overall bullish trend. The signals given by moving averages are 82.14% bullish. This strongly bullish trend seems to be running out of steam given the signals being given by short-term moving averages. The Central Indicators market scanner is currently detecting several bearish and bullish signals that could impact this trend:
Bearish trend reversal : Moving Average 20
Type : Bearish
Timeframe : Daily
Bullish price crossover with adaptative moving average 50
Type : Bullish
Timeframe : Daily
An assessment of technical indicators does not currently provide any relevant information to suggest whether the signal given by the technical indicators is more bullish or bearish.
Other results related to technical indicators were also found by the Central Indicators scanner:
Pivot points : price is over resistance 1
Type : Neutral
Timeframe : Daily
Ichimoku - Bearish crossover : Tenkan & Kijun
Type : Bearish
Timeframe : Daily
Price is back over the pivot point
Type : Bullish
Timeframe : Weekly
Central Patterns, the scanner specializing in chart patterns, did not identify any signals.
The Central Candlesticks scanner, specialised in Japanese candlesticks, did not identify any signals.
| S3 | S2 | S1 | Price | R1 | R2 | |
|---|---|---|---|---|---|---|
| ProTrendLines | 1,988.41 | 2,049.28 | 2,183.68 | 2,324.58 | 2,336.02 | 2,390.13 |
| Change (%) | -14.46% | -11.84% | -6.06% | - | +0.49% | +2.82% |
| Change | -336.17 | -275.30 | -140.90 | - | +11.44 | +65.55 |
| Level | Major | Major | Minor | - | Major | Minor |
Attention could also be paid to pivot points to set price objectives:
| Pivot points | S3 | S2 | S1 | PP | R1 | R2 | R3 |
|---|---|---|---|---|---|---|---|
| Standard | 2,235.06 | 2,256.20 | 2,278.45 | 2,299.59 | 2,321.84 | 2,342.98 | 2,365.23 |
| Camarilla | 2,288.77 | 2,292.75 | 2,296.72 | 2,300.70 | 2,304.68 | 2,308.66 | 2,312.63 |
| Woodie | 2,235.62 | 2,256.48 | 2,279.01 | 2,299.87 | 2,322.40 | 2,343.26 | 2,365.79 |
| Fibonacci | 2,256.20 | 2,272.78 | 2,283.02 | 2,299.59 | 2,316.17 | 2,326.41 | 2,342.98 |
| Pivot points | S3 | S2 | S1 | PP | R1 | R2 | R3 |
|---|---|---|---|---|---|---|---|
| Standard | 2,200.35 | 2,238.85 | 2,269.77 | 2,308.27 | 2,339.19 | 2,377.69 | 2,408.61 |
| Camarilla | 2,281.61 | 2,287.97 | 2,294.34 | 2,300.70 | 2,307.06 | 2,313.43 | 2,319.79 |
| Woodie | 2,196.57 | 2,236.96 | 2,265.99 | 2,306.38 | 2,335.41 | 2,375.80 | 2,404.83 |
| Fibonacci | 2,238.85 | 2,265.37 | 2,281.75 | 2,308.27 | 2,334.79 | 2,351.17 | 2,377.69 |
| Pivot points | S3 | S2 | S1 | PP | R1 | R2 | R3 |
|---|---|---|---|---|---|---|---|
| Standard | 1,999.72 | 2,114.12 | 2,202.75 | 2,317.15 | 2,405.78 | 2,520.18 | 2,608.81 |
| Camarilla | 2,235.55 | 2,254.16 | 2,272.77 | 2,291.38 | 2,309.99 | 2,328.60 | 2,347.21 |
| Woodie | 1,986.84 | 2,107.68 | 2,189.87 | 2,310.71 | 2,392.90 | 2,513.74 | 2,595.93 |
| Fibonacci | 2,114.12 | 2,191.68 | 2,239.59 | 2,317.15 | 2,394.71 | 2,442.62 | 2,520.18 |
Numerical data
The following is the status of the technical indicators and moving averages at the time of publication of this technical analysis:
| RSI (14): | 54.71 | |
| MACD (12,26,9): | 17.3000 | |
| Directional Movement: | 1.45 | |
| AROON (14): | -71.43 | |
| DEMA (21): | 2,347.11 | |
| Parabolic SAR (0,02-0,02-0,2): | 2,349.33 | |
| Elder Ray (13): | -9.83 | |
| Super Trend (3,10): | 2,265.09 | |
| Zig ZAG (10): | 2,324.84 | |
| VORTEX (21): | 1.0300 | |
| Stochastique (14,3,5): | 22.13 | |
| TEMA (21): | 2,322.60 | |
| Williams %R (14): | -66.99 | |
| Chande Momentum Oscillator (20): | -56.01 | |
| Repulse (5,40,3): | 1.0200 | |
| ROCnROLL: | 1 | |
| TRIX (15,9): | 0.2000 | |
| Courbe Coppock: | 4.17 |
| MA7: | 2,316.24 | |
| MA20: | 2,341.68 | |
| MA50: | 2,240.98 | |
| MA100: | 2,137.05 | |
| MAexp7: | 2,317.36 | |
| MAexp20: | 2,315.52 | |
| MAexp50: | 2,250.99 | |
| MAexp100: | 2,170.43 | |
| Price / MA7: | +0.36% | |
| Price / MA20: | -0.73% | |
| Price / MA50: | +3.73% | |
| Price / MA100: | +8.78% | |
| Price / MAexp7: | +0.31% | |
| Price / MAexp20: | +0.39% | |
| Price / MAexp50: | +3.27% | |
| Price / MAexp100: | +7.10% |
News
The last news published on GOLD - USD at the time of the generation of this analysis was as follows:
-
 Gold Daily Forecast and Technical Analysis for May 6, by Chris Lewis, #XAUUSD, #FXEmpire #gold
-
Gold Daily Forecast and Technical Analysis for May 06, 2024, by Chris Lewis for FX Empire
-
Gold Star families fall victim to Army-appointed ‘con man’
-
Gold Long Term Forecast for May 5, by Chris Lewis, for #fxempire #trading #gold #xauusd
-
Gold Daily Forecast and Technical Analysis for May 03, 2024 by Bruce Powers, CMT, FX Empire
About author

Online


Add a comment
Comments
0 comments on the analysis GOLD - USD - Daily