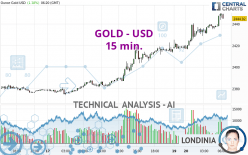
GOLD - USD - 15 min. - Technical analysis published on 05/20/2024 (GMT)
- 102
- 0
Click here for a new analysis!
- Timeframe : 15 min.
- - Analysis generated on
- Status : LEVEL MAINTAINED

Summary of the analysis

Additional analysis
Quotes
The GOLD - USD price is 2,444.96 USD. The price has increased by +1.18% since the last closing and was between 2,416.54 USD and 2,450.09 USD. This implies that the price is at +1.18% from its lowest and at -0.21% from its highest.A bullish opening was detected by the Central Gaps scanner. Buyers are trying to impose a bullish momentum in the very short term.
Bullish opening
Type : Bullish
Timeframe : Openning
Here is a more detailed summary of the historical variations registered by GOLD - USD:
New HIGH record (5 years)
Type : Bullish
Timeframe : Weekly
New HIGH record (1 year)
Type : Bullish
Timeframe : Weekly
New HIGH record (1st january)
Type : Bullish
Timeframe : Weekly
New HIGH record (1 month)
Type : Bullish
Timeframe : Weekly
Technical
A technical analysis in 15 min. of this GOLD - USD chart shows a strongly bullish trend. 92.86% of the signals given by moving averages are bullish. The overall trend is supported by the strong bullish signals from short-term moving averages. There is no crossing of moving average by the price or crossing of moving averages between themselves.
In fact, 13 technical indicators on 18 studied are currently positioned bullish. Caution: the Central Indicators scanner currently detects an excess:
RSI indicator is overbought : over 70
Type : Neutral
Timeframe : 15 minutes
CCI indicator is overbought : over 100
Type : Neutral
Timeframe : 15 minutes
Previous candle closed over Bollinger bands
Type : Neutral
Timeframe : 15 minutes
CCI indicator: bearish divergence
Type : Bearish
Timeframe : 15 minutes
Williams %R indicator is overbought : over -20
Type : Neutral
Timeframe : 15 minutes
Pivot points : price is over resistance 1
Type : Neutral
Timeframe : 15 minutes
Pivot points : price is over resistance 1
Type : Neutral
Timeframe : Weekly
The analysis of the price chart with Central Patterns scanners does not return any result.
From the Japanese candlestick perspective, the Central Candlesticks scanner notes the presence of these results that could impact the short-term trend:
Bullish harami
Type : Bullish
Timeframe : 15 minutes
Bearish engulfing lines
Type : Bearish
Timeframe : 15 minutes
| S3 | S2 | S1 | Price | |
|---|---|---|---|---|
| ProTrendLines | 2,374.01 | 2,390.13 | 2,397.46 | 2,444.96 |
| Change (%) | -2.90% | -2.24% | -1.94% | - |
| Change | -70.95 | -54.83 | -47.50 | - |
| Level | Intermediate | Intermediate | Minor | - |
Pivot points can also be used to set your price objectives. Here is the price situation in relation to pivot points:
| Pivot points | S3 | S2 | S1 | PP | R1 | R2 | R3 |
|---|---|---|---|---|---|---|---|
| Standard | 2,337.18 | 2,355.57 | 2,386.00 | 2,404.39 | 2,434.82 | 2,453.21 | 2,483.64 |
| Camarilla | 2,403.00 | 2,407.47 | 2,411.95 | 2,416.42 | 2,420.90 | 2,425.37 | 2,429.85 |
| Woodie | 2,343.19 | 2,358.58 | 2,392.01 | 2,407.40 | 2,440.83 | 2,456.22 | 2,489.65 |
| Fibonacci | 2,355.57 | 2,374.22 | 2,385.74 | 2,404.39 | 2,423.04 | 2,434.56 | 2,453.21 |
| Pivot points | S3 | S2 | S1 | PP | R1 | R2 | R3 |
|---|---|---|---|---|---|---|---|
| Standard | 2,267.63 | 2,299.93 | 2,358.18 | 2,390.48 | 2,448.73 | 2,481.03 | 2,539.28 |
| Camarilla | 2,391.52 | 2,399.82 | 2,408.12 | 2,416.42 | 2,424.72 | 2,433.02 | 2,441.32 |
| Woodie | 2,280.60 | 2,306.42 | 2,371.15 | 2,396.97 | 2,461.70 | 2,487.52 | 2,552.25 |
| Fibonacci | 2,299.93 | 2,334.52 | 2,355.89 | 2,390.48 | 2,425.07 | 2,446.44 | 2,481.03 |
| Pivot points | S3 | S2 | S1 | PP | R1 | R2 | R3 |
|---|---|---|---|---|---|---|---|
| Standard | 1,999.72 | 2,114.12 | 2,202.75 | 2,317.15 | 2,405.78 | 2,520.18 | 2,608.81 |
| Camarilla | 2,235.55 | 2,254.16 | 2,272.77 | 2,291.38 | 2,309.99 | 2,328.60 | 2,347.21 |
| Woodie | 1,986.84 | 2,107.68 | 2,189.87 | 2,310.71 | 2,392.90 | 2,513.74 | 2,595.93 |
| Fibonacci | 2,114.12 | 2,191.68 | 2,239.59 | 2,317.15 | 2,394.71 | 2,442.62 | 2,520.18 |
Numerical data
The following is the status of the technical indicators and moving averages at the time of publication of this technical analysis:
| RSI (14): | 73.91 | |
| MACD (12,26,9): | 6.2500 | |
| Directional Movement: | 27.46 | |
| AROON (14): | 85.72 | |
| DEMA (21): | 2,445.16 | |
| Parabolic SAR (0,02-0,02-0,2): | 2,436.51 | |
| Elder Ray (13): | 7.30 | |
| Super Trend (3,10): | 2,436.34 | |
| Zig ZAG (10): | 2,448.16 | |
| VORTEX (21): | 1.2200 | |
| Stochastique (14,3,5): | 97.66 | |
| TEMA (21): | 2,446.83 | |
| Williams %R (14): | -10.45 | |
| Chande Momentum Oscillator (20): | 15.43 | |
| Repulse (5,40,3): | 0.2900 | |
| ROCnROLL: | 1 | |
| TRIX (15,9): | 0.0300 | |
| Courbe Coppock: | 0.93 |
| MA7: | 2,384.65 | |
| MA20: | 2,342.43 | |
| MA50: | 2,295.22 | |
| MA100: | 2,168.95 | |
| MAexp7: | 2,445.30 | |
| MAexp20: | 2,437.44 | |
| MAexp50: | 2,426.35 | |
| MAexp100: | 2,413.95 | |
| Price / MA7: | +2.53% | |
| Price / MA20: | +4.38% | |
| Price / MA50: | +6.52% | |
| Price / MA100: | +12.73% | |
| Price / MAexp7: | -0.01% | |
| Price / MAexp20: | +0.31% | |
| Price / MAexp50: | +0.77% | |
| Price / MAexp100: | +1.28% |
News
The latest news and videos published on GOLD - USD at the time of the analysis were as follows:
-
 Gold Long Term Forecast for May 19, by Chris Lewis, for #fxempire #trading #gold #xauusd
-
Gold Daily Forecast and Technical Analysis for May 17, 2024 by Bruce Powers, CMT, FX Empire
-
Gold Daily Forecast and Technical Analysis for May 17, 2024, by Chris Lewis for FX Empire
-
Gold Daily Forecast and Technical Analysis for May 16, 2024 by Bruce Powers, CMT, FX Empire
-
Gold Forecast May 17, 2024
About author

Online


Add a comment
Comments
0 comments on the analysis GOLD - USD - 15 min.