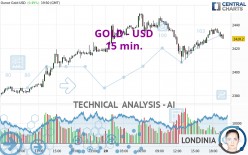
GOLD - USD - 15 min. - Technical analysis published on 05/20/2024 (GMT)
- 76
- 0
- Timeframe : 15 min.
- - Analysis generated on
- Status : NEUTRAL

Summary of the analysis

Additional analysis
Quotes
GOLD - USD rating 2,428.23 USD. On the day, this instrument gained +0.49% with the lowest point at 2,407.38 USD and the highest point at 2,450.09 USD. The deviation from the price is +0.87% for the low point and -0.89% for the high point.The Central Gaps scanner detects a bullish opening marking the presence of buyers ahead of sellers at the opening but not sufficiently marked to allow the price to register a quotation gap.
Bullish opening
Type : Bullish
Timeframe : Openning
A study of price movements over other periods shows the following variations:
New HIGH record (5 years)
Type : Bullish
Timeframe : Weekly
New HIGH record (1 year)
Type : Bullish
Timeframe : Weekly
New HIGH record (1st january)
Type : Bullish
Timeframe : Weekly
New HIGH record (1 month)
Type : Bullish
Timeframe : Weekly
Technical
A technical analysis in 15 min. of this GOLD - USD chart shows a slightly bullish trend. 57.14% of the signals given by moving averages are bullish. Caution: the slightly bearish signals currently given by short-term moving averages indicate that this slightly bullish trend could be reversed. The Central Indicators market scanner is currently detecting several bearish and bullish signals that could impact this trend:
Bearish trend reversal : adaptative moving average 20
Type : Bearish
Timeframe : 15 minutes
Bullish price crossover with Moving Average 50
Type : Bullish
Timeframe : 15 minutes
Bullish price crossover with adaptative moving average 20
Type : Bullish
Timeframe : 15 minutes
An assessment of technical indicators shows a slightly bullish signal.
Central Indicators, the scanner specialised in technical indicators, has identified these signals:
RSI indicator is back over 50
Type : Bullish
Timeframe : 15 minutes
Williams %R indicator is back over -50
Type : Bullish
Timeframe : 15 minutes
No signals are given by Central Patterns, a market scanner specialised in chart patterns, resistances and supports.
For a small rebound in the very short term, the Central Candlesticks scanner currently notes the presence of this bullish pattern in Japanese candlesticks:
Bullish harami
Type : Bullish
Timeframe : 15 minutes
| S3 | S2 | S1 | Price | |
|---|---|---|---|---|
| ProTrendLines | 2,374.01 | 2,390.13 | 2,397.46 | 2,428.23 |
| Change (%) | -2.23% | -1.57% | -1.27% | - |
| Change | -54.22 | -38.10 | -30.77 | - |
| Level | Intermediate | Intermediate | Minor | - |
Pivot points can also be used to set your price objectives. Here is the price situation in relation to pivot points:
| Pivot points | S3 | S2 | S1 | PP | R1 | R2 | R3 |
|---|---|---|---|---|---|---|---|
| Standard | 2,337.18 | 2,355.57 | 2,386.00 | 2,404.39 | 2,434.82 | 2,453.21 | 2,483.64 |
| Camarilla | 2,403.00 | 2,407.47 | 2,411.95 | 2,416.42 | 2,420.90 | 2,425.37 | 2,429.85 |
| Woodie | 2,343.19 | 2,358.58 | 2,392.01 | 2,407.40 | 2,440.83 | 2,456.22 | 2,489.65 |
| Fibonacci | 2,355.57 | 2,374.22 | 2,385.74 | 2,404.39 | 2,423.04 | 2,434.56 | 2,453.21 |
| Pivot points | S3 | S2 | S1 | PP | R1 | R2 | R3 |
|---|---|---|---|---|---|---|---|
| Standard | 2,267.63 | 2,299.93 | 2,358.18 | 2,390.48 | 2,448.73 | 2,481.03 | 2,539.28 |
| Camarilla | 2,391.52 | 2,399.82 | 2,408.12 | 2,416.42 | 2,424.72 | 2,433.02 | 2,441.32 |
| Woodie | 2,280.60 | 2,306.42 | 2,371.15 | 2,396.97 | 2,461.70 | 2,487.52 | 2,552.25 |
| Fibonacci | 2,299.93 | 2,334.52 | 2,355.89 | 2,390.48 | 2,425.07 | 2,446.44 | 2,481.03 |
| Pivot points | S3 | S2 | S1 | PP | R1 | R2 | R3 |
|---|---|---|---|---|---|---|---|
| Standard | 1,999.72 | 2,114.12 | 2,202.75 | 2,317.15 | 2,405.78 | 2,520.18 | 2,608.81 |
| Camarilla | 2,235.55 | 2,254.16 | 2,272.77 | 2,291.38 | 2,309.99 | 2,328.60 | 2,347.21 |
| Woodie | 1,986.84 | 2,107.68 | 2,189.87 | 2,310.71 | 2,392.90 | 2,513.74 | 2,595.93 |
| Fibonacci | 2,114.12 | 2,191.68 | 2,239.59 | 2,317.15 | 2,394.71 | 2,442.62 | 2,520.18 |
Numerical data
The following is the status of the technical indicators and moving averages at the time of publication of this technical analysis:
| RSI (14): | 50.22 | |
| MACD (12,26,9): | 1.6100 | |
| Directional Movement: | -5.51 | |
| AROON (14): | 57.15 | |
| DEMA (21): | 2,432.39 | |
| Parabolic SAR (0,02-0,02-0,2): | 2,436.95 | |
| Elder Ray (13): | -0.95 | |
| Super Trend (3,10): | 2,423.86 | |
| Zig ZAG (10): | 2,432.03 | |
| VORTEX (21): | 1.1700 | |
| Stochastique (14,3,5): | 61.11 | |
| TEMA (21): | 2,434.75 | |
| Williams %R (14): | -34.66 | |
| Chande Momentum Oscillator (20): | 4.89 | |
| Repulse (5,40,3): | -0.0200 | |
| ROCnROLL: | -1 | |
| TRIX (15,9): | 0.0100 | |
| Courbe Coppock: | 0.72 |
| MA7: | 2,381.91 | |
| MA20: | 2,341.52 | |
| MA50: | 2,294.85 | |
| MA100: | 2,168.77 | |
| MAexp7: | 2,431.31 | |
| MAexp20: | 2,430.43 | |
| MAexp50: | 2,429.25 | |
| MAexp100: | 2,424.67 | |
| Price / MA7: | +1.94% | |
| Price / MA20: | +3.70% | |
| Price / MA50: | +5.81% | |
| Price / MA100: | +11.96% | |
| Price / MAexp7: | -0.13% | |
| Price / MAexp20: | -0.09% | |
| Price / MAexp50: | -0.04% | |
| Price / MAexp100: | +0.15% |
News
Don't forget to follow the news on GOLD - USD. At the time of publication of this analysis, the latest news was as follows:
-
 Gold Daily Forecast and Technical Analysis for May 20, by Chris Lewis, #XAUUSD, #FXEmpire #gold
-
Gold Daily Forecast and Technical Analysis for May 20, 2024, by Chris Lewis for FX Empire
-
Gold Long Term Forecast for May 19, by Chris Lewis, for #fxempire #trading #gold #xauusd
-
Gold Daily Forecast and Technical Analysis for May 17, 2024 by Bruce Powers, CMT, FX Empire
-
Gold Daily Forecast and Technical Analysis for May 17, 2024, by Chris Lewis for FX Empire
About author

Online


Add a comment
Comments
0 comments on the analysis GOLD - USD - 15 min.