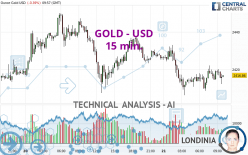
GOLD - USD - 15 min. - Technical analysis published on 05/21/2024 (GMT)
- 74
- 0
Click here for a new analysis!
- Timeframe : 15 min.
- - Analysis generated on
- Status : INVALID

Summary of the analysis

Additional analysis
Quotes
The GOLD - USD rating is 2,416.86 USD. The price registered a decrease of -0.39% on the session and was between 2,406.29 USD and 2,433.09 USD. This implies that the price is at +0.44% from its lowest and at -0.67% from its highest.The Central Gaps scanner detects a bullish opening marking the presence of buyers ahead of sellers at the opening but not sufficiently marked to allow the price to register a quotation gap.
Bullish opening
Type : Bullish
Timeframe : Openning
So that you have an overall view of the price change, here is a table showing the variations over several periods:
New HIGH record (5 years)
Type : Bullish
Timeframe : Weekly
Near a new HIGH record (1 year)
Type : Bullish
Timeframe : Weekly
Near a new HIGH record (1st january)
Type : Bullish
Timeframe : Weekly
Near a new HIGH record (1 month)
Type : Bullish
Timeframe : Weekly
Technical
A technical analysis in 15 min. of this GOLD - USD chart shows a bearish trend. 78.57% of the signals given by moving averages are bearish. Caution: the neutral signals currently given by short-term moving averages show us that the global trend is losing momentum. An assessment of moving averages reveals several bearish signals that could impact this trend:
Bearish price crossover with Moving Average 20
Type : Bearish
Timeframe : 15 minutes
Bearish price crossover with adaptative moving average 20
Type : Bearish
Timeframe : 15 minutes
On the 18 technical indicators analysed, 6 are bullish, 9 are neutral and 3 are bearish. Central Indicators, the scanner specialised in technical indicators, has identified these signals:
Parabolic SAR indicator bearish reversal
Type : Bearish
Timeframe : 15 minutes
Momentum indicator is back under 0
Type : Bearish
Timeframe : 15 minutes
Williams %R indicator is back under -50
Type : Bearish
Timeframe : 15 minutes
Central Patterns, the scanner specializing in chart patterns, did not identify any signals.
The Central Candlesticks scanner which studies Japanese candlesticks did not detect anything.
| S3 | S2 | S1 | Price | R1 | R2 | |
|---|---|---|---|---|---|---|
| ProTrendLines | 2,378.50 | 2,390.13 | 2,407.38 | 2,416.86 | 2,437.39 | 2,450.09 |
| Change (%) | -1.59% | -1.11% | -0.39% | - | +0.85% | +1.37% |
| Change | -38.36 | -26.73 | -9.48 | - | +20.53 | +33.23 |
| Level | Intermediate | Intermediate | Intermediate | - | Minor | Major |
Pivot points can also be used to set your price objectives. Here is the price situation in relation to pivot points:
| Pivot points | S3 | S2 | S1 | PP | R1 | R2 | R3 |
|---|---|---|---|---|---|---|---|
| Standard | 2,362.99 | 2,385.18 | 2,405.70 | 2,427.89 | 2,448.41 | 2,470.60 | 2,491.12 |
| Camarilla | 2,414.47 | 2,418.38 | 2,422.30 | 2,426.21 | 2,430.13 | 2,434.04 | 2,437.96 |
| Woodie | 2,362.15 | 2,384.76 | 2,404.86 | 2,427.47 | 2,447.57 | 2,470.18 | 2,490.28 |
| Fibonacci | 2,385.18 | 2,401.50 | 2,411.58 | 2,427.89 | 2,444.21 | 2,454.29 | 2,470.60 |
| Pivot points | S3 | S2 | S1 | PP | R1 | R2 | R3 |
|---|---|---|---|---|---|---|---|
| Standard | 2,267.63 | 2,299.93 | 2,358.18 | 2,390.48 | 2,448.73 | 2,481.03 | 2,539.28 |
| Camarilla | 2,391.52 | 2,399.82 | 2,408.12 | 2,416.42 | 2,424.72 | 2,433.02 | 2,441.32 |
| Woodie | 2,280.60 | 2,306.42 | 2,371.15 | 2,396.97 | 2,461.70 | 2,487.52 | 2,552.25 |
| Fibonacci | 2,299.93 | 2,334.52 | 2,355.89 | 2,390.48 | 2,425.07 | 2,446.44 | 2,481.03 |
| Pivot points | S3 | S2 | S1 | PP | R1 | R2 | R3 |
|---|---|---|---|---|---|---|---|
| Standard | 1,999.72 | 2,114.12 | 2,202.75 | 2,317.15 | 2,405.78 | 2,520.18 | 2,608.81 |
| Camarilla | 2,235.55 | 2,254.16 | 2,272.77 | 2,291.38 | 2,309.99 | 2,328.60 | 2,347.21 |
| Woodie | 1,986.84 | 2,107.68 | 2,189.87 | 2,310.71 | 2,392.90 | 2,513.74 | 2,595.93 |
| Fibonacci | 2,114.12 | 2,191.68 | 2,239.59 | 2,317.15 | 2,394.71 | 2,442.62 | 2,520.18 |
Numerical data
The following are the details of the technical indicators and moving averages that were collected to generate this technical analysis:
| RSI (14): | 50.36 | |
| MACD (12,26,9): | -0.3000 | |
| Directional Movement: | -0.79 | |
| AROON (14): | 21.43 | |
| DEMA (21): | 2,416.04 | |
| Parabolic SAR (0,02-0,02-0,2): | 2,412.24 | |
| Elder Ray (13): | 0.35 | |
| Super Trend (3,10): | 2,423.98 | |
| Zig ZAG (10): | 2,416.48 | |
| VORTEX (21): | 1.0500 | |
| Stochastique (14,3,5): | 62.45 | |
| TEMA (21): | 2,417.29 | |
| Williams %R (14): | -45.38 | |
| Chande Momentum Oscillator (20): | 0.57 | |
| Repulse (5,40,3): | -0.1500 | |
| ROCnROLL: | 2 | |
| TRIX (15,9): | -0.0100 | |
| Courbe Coppock: | 0.17 |
| MA7: | 2,389.07 | |
| MA20: | 2,345.99 | |
| MA50: | 2,299.42 | |
| MA100: | 2,172.27 | |
| MAexp7: | 2,416.53 | |
| MAexp20: | 2,417.04 | |
| MAexp50: | 2,419.43 | |
| MAexp100: | 2,420.80 | |
| Price / MA7: | +1.16% | |
| Price / MA20: | +3.02% | |
| Price / MA50: | +5.11% | |
| Price / MA100: | +11.26% | |
| Price / MAexp7: | +0.01% | |
| Price / MAexp20: | -0.01% | |
| Price / MAexp50: | -0.11% | |
| Price / MAexp100: | -0.16% |
News
The last news published on GOLD - USD at the time of the generation of this analysis was as follows:
-
 World Judo Championship: Heydarov Finally Strikes World Gold
-
Gold Daily Forecast and Technical Analysis for May 20, by Chris Lewis, #XAUUSD, #FXEmpire #gold
-
Gold Daily Forecast and Technical Analysis for May 20, 2024, by Chris Lewis for FX Empire
-
Gold Long Term Forecast for May 19, by Chris Lewis, for #fxempire #trading #gold #xauusd
-
Gold Daily Forecast and Technical Analysis for May 17, 2024 by Bruce Powers, CMT, FX Empire
About author

Online


Add a comment
Comments
0 comments on the analysis GOLD - USD - 15 min.