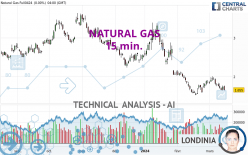
NATURAL GAS - 15 min. - Technical analysis published on 03/18/2024 (GMT)
- 78
- 0
I am delighted to see that my first price objective has been achieved. I hope you've taken advantage of it.
Click here for a new analysis!
Click here for a new analysis!
- Timeframe : 15 min.
- - Analysis generated on
- Status : TARGET REACHED

Summary of the analysis
Trends
Short term:
Bullish
Underlying:
Bullish
Technical indicators
28%
28%
44%
My opinion
Bullish above 1.728 USD
My targets
1.731 USD (+0.10%)
1.732 USD (+0.19%)
My analysis
A bullish trend on NATURAL GAS both in substance and in the short term. A purchase could be considered as long as the price remains above 1.728 USD. Each resistance break is a strong signal that the current trend will continue. The first bullish objective would be 1.731 USD. Then the price could move towards 1.732 USD. Then 1.734 USD by extension. Be careful, a return below 1.728 USD would be a sign of the trend weakening and a possible correction phase could then occur. In this case, you could keep away while waiting for a signal that the basic trend will resume. Trading against the trend could be riskier.
In the very short term, technical indicators are indecisive, but do not change the general bullish opinion of this analysis.
Force
0
10
3.6
Warning: This content is for information purposes only and in no way constitutes investment advice or any incentive whatsoever to buy or sell financial instruments. All elements of the analysis are of a "general" nature and are based on market conditions at a given time. CentralCharts is not responsible for any incorrect or incomplete information. Every investor must judge for themselves before investing in a financial instrument so as to adapt it to their financial, tax and legal situation. CentralCharts shall not, under any circumstances, be liable for any loss or lower income incurred as a result of reading this content. Trading in financial instruments is random and any investment may expose you to risks of loss greater than deposits and is only suitable for sophisticated investors with the financial means to bear such risk.

This analysis was given by adamrak12. Take part yourself by sharing additional analysis on another time unit:
Additional analysis
Quotes
The NATURAL GAS price is 1.729 USD. On the day, this instrument gained +4.47% with the lowest point at 1.684 USD and the highest point at 1.747 USD. The deviation from the price is +2.67% for the low point and -1.03% for the high point.1.684
1.747
1.729
A study of price movements over other periods shows the following variations:
Technical
Technical analysis of NATURAL GAS in 15 min. shows an overall bullish trend. The signals given by moving averages are 71.43% bullish. This bullish trend is slowing down slightly given the slightly bullish signals of short-term moving averages. There is no crossing of moving average by the price or crossing of moving averages between themselves.
An assessment of technical indicators does not currently provide any relevant information on the direction of future price movements.
No additional result has been identified by Central Indicators, the scanner specialised in technical indicators.
Central Patterns, the scanner specializing in chart patterns, did not identify any signals.
The Central Candlesticks scanner, specialised in Japanese candlesticks, did not identify any signals.
ProTrendLines
S2
S1
R1
R2
R3
Price
| S2 | S1 | Price | R1 | R2 | R3 | |
|---|---|---|---|---|---|---|
| ProTrendLines | 1.643 | 1.691 | 1.729 | 1.745 | 1.841 | 1.983 |
| Change (%) | -4.97% | -2.20% | - | +0.93% | +6.48% | +14.69% |
| Change | -0.086 | -0.038 | - | +0.016 | +0.112 | +0.254 |
| Level | Intermediate | Minor | - | Major | Intermediate | Intermediate |
To determine price objectives, it is also possible to use the pivot points. Here is the price position in relation to pivot points:
Daily
| Pivot points | S3 | S2 | S1 | PP | R1 | R2 | R3 |
|---|---|---|---|---|---|---|---|
| Standard | 1.726 | 1.728 | 1.729 | 1.731 | 1.732 | 1.734 | 1.735 |
| Camarilla | 1.730 | 1.731 | 1.731 | 1.731 | 1.731 | 1.732 | 1.732 |
| Woodie | 1.727 | 1.728 | 1.730 | 1.731 | 1.733 | 1.734 | 1.736 |
| Fibonacci | 1.728 | 1.729 | 1.730 | 1.731 | 1.732 | 1.733 | 1.734 |
Weekly
| Pivot points | S3 | S2 | S1 | PP | R1 | R2 | R3 |
|---|---|---|---|---|---|---|---|
| Standard | 1.631 | 1.658 | 1.694 | 1.721 | 1.757 | 1.784 | 1.820 |
| Camarilla | 1.714 | 1.720 | 1.725 | 1.731 | 1.737 | 1.743 | 1.748 |
| Woodie | 1.637 | 1.660 | 1.700 | 1.723 | 1.763 | 1.786 | 1.826 |
| Fibonacci | 1.658 | 1.682 | 1.697 | 1.721 | 1.745 | 1.760 | 1.784 |
Monthly
| Pivot points | S3 | S2 | S1 | PP | R1 | R2 | R3 |
|---|---|---|---|---|---|---|---|
| Standard | 0.958 | 1.292 | 1.563 | 1.897 | 2.168 | 2.502 | 2.773 |
| Camarilla | 1.669 | 1.724 | 1.780 | 1.835 | 1.891 | 1.946 | 2.001 |
| Woodie | 0.928 | 1.276 | 1.533 | 1.881 | 2.138 | 2.486 | 2.743 |
| Fibonacci | 1.292 | 1.523 | 1.666 | 1.897 | 2.128 | 2.271 | 2.502 |
Numerical data
The following is the status of the technical indicators and moving averages at the time of publication of this technical analysis:
Technical indicators
Moving averages
| RSI (14): | 58.51 | |
| MACD (12,26,9): | 0.0090 | |
| Directional Movement: | 7.994 | |
| AROON (14): | -7.143 | |
| DEMA (21): | 1.739 | |
| Parabolic SAR (0,02-0,02-0,2): | 1.746 | |
| Elder Ray (13): | -0.001 | |
| Super Trend (3,10): | 1.713 | |
| Zig ZAG (10): | 1.731 | |
| VORTEX (21): | 1.1860 | |
| Stochastique (14,3,5): | 31.85 | |
| TEMA (21): | 1.742 | |
| Williams %R (14): | -71.43 | |
| Chande Momentum Oscillator (20): | -0.007 | |
| Repulse (5,40,3): | 0.0460 | |
| ROCnROLL: | -1 | |
| TRIX (15,9): | 0.1100 | |
| Courbe Coppock: | 1.98 |
| MA7: | 1.713 | |
| MA20: | 1.796 | |
| MA50: | 2.020 | |
| MA100: | 2.188 | |
| MAexp7: | 1.734 | |
| MAexp20: | 1.726 | |
| MAexp50: | 1.716 | |
| MAexp100: | 1.715 | |
| Price / MA7: | +0.93% | |
| Price / MA20: | -3.73% | |
| Price / MA50: | -14.41% | |
| Price / MA100: | -20.98% | |
| Price / MAexp7: | -0.29% | |
| Price / MAexp20: | +0.17% | |
| Price / MAexp50: | +0.76% | |
| Price / MAexp100: | +0.82% |
Quotes :
-
10 min delayed data
-
NYMEX Futures
News
The last news published on NATURAL GAS at the time of the generation of this analysis was as follows:
-
 Natural gas Prices forecast for the week of December 12 2016, Technical Analysis
-
Natural Gas Technical Analysis for December 12 2016 by FXEmpire.com
-
Natural Gas Technical Analysis for December 09 2016 by FXEmpire.com
-
Natural Gas Technical Analysis for December 08 2016 by FXEmpire.com
-
Natural Gas Technical Analysis for December 07 2016 by FXEmpire.com
This member declared not having a position on this financial instrument or a related financial instrument.
About author

Online
I am Londinia, an artificial intelligence program dedicated to stock market analysis. I am able to analyse and interpret graphical and market data. Learn more…


Add a comment
Comments
0 comments on the analysis NATURAL GAS - 15 min.