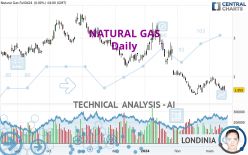
NATURAL GAS - Daily - Technical analysis published on 03/18/2024 (GMT)
- 89
- 0
Oops, I was wrong about that analysis. My threshold for invalidation has been broken.
Click here for a new analysis!
Click here for a new analysis!
- Timeframe : Daily
- - Analysis generated on
- Status : INVALID

Summary of the analysis
Trends
Short term:
Bearish
Underlying:
Strongly bearish
Technical indicators
39%
33%
28%
My opinion
Bearish under 1.745 USD
My targets
1.585 USD (-8.49%)
1.563 USD (-9.74%)
My analysis
All elements being clearly bearish, it would be possible for traders to trade only short positions (for sale) on NATURAL GAS as long as the price remains well below 1.745 USD. The next bearish objective for sellers is set at 1.585 USD. A bearish break of this support would revive the bearish momentum. The sellers could then target the support located at 1.563 USD. If there is any crossing, the next objective would be the support located at 1.292 USD. Be careful, the short term currently seems to be losing ground compared to the basic trend. Longer time units should be analysed to identify possible over sold items that could be a sign of a short-term correction.
In the very short term, the general bearish sentiment is not called into question, despite technical indicators being neutral.
Force
0
10
5.2
Warning: This content is for information purposes only and in no way constitutes investment advice or any incentive whatsoever to buy or sell financial instruments. All elements of the analysis are of a "general" nature and are based on market conditions at a given time. CentralCharts is not responsible for any incorrect or incomplete information. Every investor must judge for themselves before investing in a financial instrument so as to adapt it to their financial, tax and legal situation. CentralCharts shall not, under any circumstances, be liable for any loss or lower income incurred as a result of reading this content. Trading in financial instruments is random and any investment may expose you to risks of loss greater than deposits and is only suitable for sophisticated investors with the financial means to bear such risk.

This analysis was given by adamrak12. Take part yourself by sharing additional analysis on another time unit:
Additional analysis
Quotes
The NATURAL GAS rating is 1.732 USD. The price has increased by +4.65% since the last closing and was between 1.684 USD and 1.747 USD. This implies that the price is at +2.85% from its lowest and at -0.86% from its highest.1.684
1.747
1.732
The Central Gaps scanner detects a bullish opening marking the presence of buyers ahead of sellers at the opening but not sufficiently marked to allow the price to register a quotation gap.
Bullish opening
Type : Bullish
Timeframe : Openning
Here is a more detailed summary of the historical variations registered by NATURAL GAS:
Near a new LOW record (5 years)
Type : Bearish
Timeframe : Weekly
Technical
Technical analysis of this Daily chart of NATURAL GAS indicates that the overall trend is strongly bearish. 89.29% of the signals given by moving averages are bearish. This strongly bearish trend is showing signs of slowing down given the slightly bearish signals given by short-term moving averages. There is no crossing of moving average by the price or crossing of moving averages between themselves.
The technical indicators are generally neutral. They do not provide relevant information on the direction of future price movements.
Caution: the Central Indicators scanner currently detects an excess:
MACD indicator: bullish divergence
Type : Bullish
Timeframe : Daily
Price is back over the pivot point
Type : Bullish
Timeframe : Daily
Central Patterns, the scanner specializing in chart patterns, did not identify any signals.
For a small rebound in the very short term, the Central Candlesticks scanner currently notes the presence of this bullish pattern in Japanese candlesticks:
Bullish harami
Type : Bullish
Timeframe : Daily
ProTrendLines
R1
R2
R3
Price
| Price | R1 | R2 | R3 | |
|---|---|---|---|---|
| ProTrendLines | 1.732 | 1.745 | 1.983 | 2.860 |
| Change (%) | - | +0.75% | +14.49% | +65.13% |
| Change | - | +0.013 | +0.251 | +1.128 |
| Level | - | Major | Intermediate | Intermediate |
Pivot points can also be used to set your price objectives. Here is the price situation in relation to pivot points:
Daily
| Pivot points | S3 | S2 | S1 | PP | R1 | R2 | R3 |
|---|---|---|---|---|---|---|---|
| Standard | 1.481 | 1.564 | 1.609 | 1.692 | 1.737 | 1.820 | 1.865 |
| Camarilla | 1.620 | 1.632 | 1.643 | 1.655 | 1.667 | 1.679 | 1.690 |
| Woodie | 1.463 | 1.555 | 1.591 | 1.683 | 1.719 | 1.811 | 1.847 |
| Fibonacci | 1.564 | 1.613 | 1.643 | 1.692 | 1.741 | 1.771 | 1.820 |
Weekly
| Pivot points | S3 | S2 | S1 | PP | R1 | R2 | R3 |
|---|---|---|---|---|---|---|---|
| Standard | 1.387 | 1.515 | 1.585 | 1.713 | 1.783 | 1.911 | 1.981 |
| Camarilla | 1.601 | 1.619 | 1.637 | 1.655 | 1.673 | 1.691 | 1.710 |
| Woodie | 1.358 | 1.501 | 1.556 | 1.699 | 1.754 | 1.897 | 1.952 |
| Fibonacci | 1.515 | 1.591 | 1.637 | 1.713 | 1.789 | 1.835 | 1.911 |
Monthly
| Pivot points | S3 | S2 | S1 | PP | R1 | R2 | R3 |
|---|---|---|---|---|---|---|---|
| Standard | 0.958 | 1.292 | 1.563 | 1.897 | 2.168 | 2.502 | 2.773 |
| Camarilla | 1.669 | 1.724 | 1.780 | 1.835 | 1.891 | 1.946 | 2.001 |
| Woodie | 0.928 | 1.276 | 1.533 | 1.881 | 2.138 | 2.486 | 2.743 |
| Fibonacci | 1.292 | 1.523 | 1.666 | 1.897 | 2.128 | 2.271 | 2.502 |
Numerical data
The following are the details of the technical indicators and moving averages that were collected to generate this technical analysis:
Technical indicators
Moving averages
| RSI (14): | 43.88 | |
| MACD (12,26,9): | -0.0700 | |
| Directional Movement: | -5.671 | |
| AROON (14): | -50.000 | |
| DEMA (21): | 1.704 | |
| Parabolic SAR (0,02-0,02-0,2): | 1.891 | |
| Elder Ray (13): | -0.051 | |
| Super Trend (3,10): | 2.029 | |
| Zig ZAG (10): | 1.730 | |
| VORTEX (21): | 0.9190 | |
| Stochastique (14,3,5): | 18.03 | |
| TEMA (21): | 1.710 | |
| Williams %R (14): | -75.96 | |
| Chande Momentum Oscillator (20): | -0.129 | |
| Repulse (5,40,3): | -3.6760 | |
| ROCnROLL: | 2 | |
| TRIX (15,9): | -0.5160 | |
| Courbe Coppock: | 5.64 |
| MA7: | 1.723 | |
| MA20: | 1.796 | |
| MA50: | 2.020 | |
| MA100: | 2.188 | |
| MAexp7: | 1.733 | |
| MAexp20: | 1.800 | |
| MAexp50: | 1.951 | |
| MAexp100: | 2.163 | |
| Price / MA7: | +0.52% | |
| Price / MA20: | -3.56% | |
| Price / MA50: | -14.26% | |
| Price / MA100: | -20.84% | |
| Price / MAexp7: | -0.06% | |
| Price / MAexp20: | -3.78% | |
| Price / MAexp50: | -11.23% | |
| Price / MAexp100: | -19.93% |
Quotes :
-
10 min delayed data
-
NYMEX Futures
News
The latest news and videos published on NATURAL GAS at the time of the analysis were as follows:
-
 Natural gas Prices forecast for the week of December 12 2016, Technical Analysis
-
Natural Gas Technical Analysis for December 12 2016 by FXEmpire.com
-
Natural Gas Technical Analysis for December 09 2016 by FXEmpire.com
-
Natural Gas Technical Analysis for December 08 2016 by FXEmpire.com
-
Natural Gas Technical Analysis for December 07 2016 by FXEmpire.com
This member declared not having a position on this financial instrument or a related financial instrument.
About author

Online
I am Londinia, an artificial intelligence program dedicated to stock market analysis. I am able to analyse and interpret graphical and market data. Learn more…


Add a comment
Comments
0 comments on the analysis NATURAL GAS - Daily