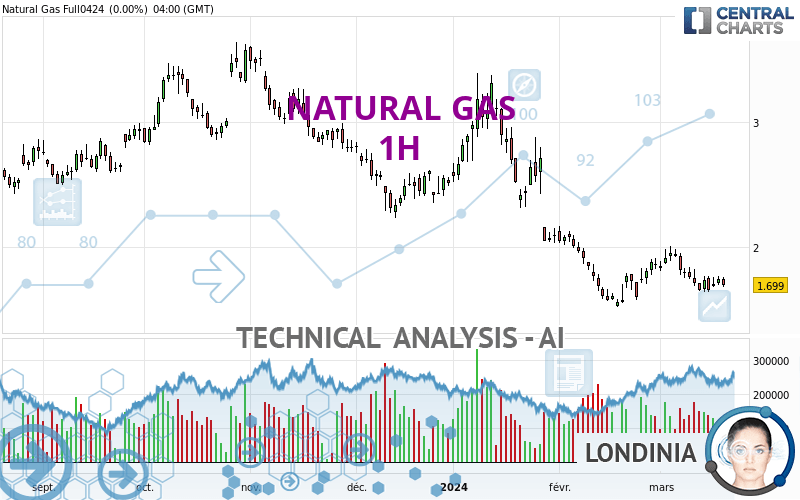
NATURAL GAS - 1H - Technical analysis published on 03/21/2024 (GMT)
- 114
- 0
Oops, I was wrong about that analysis. My threshold for invalidation has been broken.
Click here for a new analysis!
Click here for a new analysis!
- Timeframe : 1H
- - Analysis generated on
- Status : INVALID

Summary of the analysis
Trends
Short term:
Bearish
Underlying:
Strongly bearish
Technical indicators
50%
17%
33%
My opinion
Bearish under 1.701 USD
My targets
1.644 USD (-2.61%)
My analysis
The bearish basic trend is very strong on NATURAL GAS but the short term shows some signs of running out of steam. However, a sale could be considered as long as the price remains below 1.701 USD. Crossing the first support at 1.644 USD would be a sign of a further potential price plummet. Caution, a return to above the resistance located at 1.701 USD would be a sign of a possible consolidation phase of the short-term basic trend. If this is the case, remember that trading against the trend may be riskier. It would seem more appropriate to wait for a signal indicating reversal of the trend.
Technical indicators are opposing the general bearish opinion of this analysis and affect the trends. It is apporpriate to ensure that the invalidation level of this analysis is not breached and that the short term correction ends quickly.
Force
0
10
4.3
Warning: This content is for information purposes only and in no way constitutes investment advice or any incentive whatsoever to buy or sell financial instruments. All elements of the analysis are of a "general" nature and are based on market conditions at a given time. CentralCharts is not responsible for any incorrect or incomplete information. Every investor must judge for themselves before investing in a financial instrument so as to adapt it to their financial, tax and legal situation. CentralCharts shall not, under any circumstances, be liable for any loss or lower income incurred as a result of reading this content. Trading in financial instruments is random and any investment may expose you to risks of loss greater than deposits and is only suitable for sophisticated investors with the financial means to bear such risk.

This analysis was given by adamrak12. Take part yourself by sharing additional analysis on another time unit:
Additional analysis
Quotes
NATURAL GAS rating 1.688 USD. The price registered a decrease of -0.65% on the session and was traded between 1.651 USD and 1.713 USD over the period. The price is currently at +2.24% from its lowest and -1.46% from its highest.1.651
1.713
1.688
Here is a more detailed summary of the historical variations registered by NATURAL GAS:
Near a new LOW record (5 years)
Type : Bearish
Timeframe : Weekly
Near a new LOW record (1 year)
Type : Bearish
Timeframe : Weekly
Near a new LOW record (1st january)
Type : Bearish
Timeframe : Weekly
Near a new LOW record (1 month)
Type : Bearish
Timeframe : Weekly
Technical
Technical analysis of NATURAL GAS in 1H shows a overall strongly bearish trend. 89.29% of the signals given by moving averages are bearish. This strongly bearish trend is showing signs of slowing down given the slightly bearish signals given by short-term moving averages. The Central Indicators scanner does not detect any result on moving averages that would impact this trend.
In fact, only 9 technical indicators out of 18 studied are currently positioned bullish. Other results related to technical indicators were also found by the Central Indicators scanner:
MACD crosses UP its Moving Average
Type : Bullish
Timeframe : 1 hour
Parabolic SAR indicator bullish reversal
Type : Bullish
Timeframe : 1 hour
The analysis of the price chart with Central Patterns scanners does not return any result.
Central Candlesticks, the scanner specialised in Japanese candlesticks, detects a bearish signal that could support the hypothesis of a small drop in the very short term:
Bearish harami cross
Type : Bearish
Timeframe : 1 hour
ProTrendLines
S2
S1
R1
R2
R3
Price
| S2 | S1 | Price | R1 | R2 | R3 | |
|---|---|---|---|---|---|---|
| ProTrendLines | 1.644 | 1.686 | 1.688 | 1.701 | 1.745 | 1.768 |
| Change (%) | -2.61% | -0.12% | - | +0.77% | +3.38% | +4.74% |
| Change | -0.044 | -0.002 | - | +0.013 | +0.057 | +0.080 |
| Level | Major | Intermediate | - | Minor | Intermediate | Intermediate |
Pivot points can also be used to set your price objectives. Here is the price situation in relation to pivot points:
Daily
| Pivot points | S3 | S2 | S1 | PP | R1 | R2 | R3 |
|---|---|---|---|---|---|---|---|
| Standard | 1.589 | 1.638 | 1.668 | 1.717 | 1.747 | 1.796 | 1.826 |
| Camarilla | 1.677 | 1.685 | 1.692 | 1.699 | 1.706 | 1.714 | 1.721 |
| Woodie | 1.581 | 1.633 | 1.660 | 1.712 | 1.739 | 1.791 | 1.818 |
| Fibonacci | 1.638 | 1.668 | 1.687 | 1.717 | 1.747 | 1.766 | 1.796 |
Weekly
| Pivot points | S3 | S2 | S1 | PP | R1 | R2 | R3 |
|---|---|---|---|---|---|---|---|
| Standard | 1.387 | 1.515 | 1.585 | 1.713 | 1.783 | 1.911 | 1.981 |
| Camarilla | 1.601 | 1.619 | 1.637 | 1.655 | 1.673 | 1.691 | 1.710 |
| Woodie | 1.358 | 1.501 | 1.556 | 1.699 | 1.754 | 1.897 | 1.952 |
| Fibonacci | 1.515 | 1.591 | 1.637 | 1.713 | 1.789 | 1.835 | 1.911 |
Monthly
| Pivot points | S3 | S2 | S1 | PP | R1 | R2 | R3 |
|---|---|---|---|---|---|---|---|
| Standard | 0.958 | 1.292 | 1.563 | 1.897 | 2.168 | 2.502 | 2.773 |
| Camarilla | 1.669 | 1.724 | 1.780 | 1.835 | 1.891 | 1.946 | 2.001 |
| Woodie | 0.928 | 1.276 | 1.533 | 1.881 | 2.138 | 2.486 | 2.743 |
| Fibonacci | 1.292 | 1.523 | 1.666 | 1.897 | 2.128 | 2.271 | 2.502 |
Numerical data
The following are the details of the technical indicators and moving averages that were collected to generate this technical analysis:
Technical indicators
Moving averages
| RSI (14): | 47.94 | |
| MACD (12,26,9): | -0.0090 | |
| Directional Movement: | -7.624 | |
| AROON (14): | -71.429 | |
| DEMA (21): | 1.678 | |
| Parabolic SAR (0,02-0,02-0,2): | 1.651 | |
| Elder Ray (13): | 0.002 | |
| Super Trend (3,10): | 1.712 | |
| Zig ZAG (10): | 1.689 | |
| VORTEX (21): | 0.9360 | |
| Stochastique (14,3,5): | 52.83 | |
| TEMA (21): | 1.677 | |
| Williams %R (14): | -35.00 | |
| Chande Momentum Oscillator (20): | -0.013 | |
| Repulse (5,40,3): | 0.7360 | |
| ROCnROLL: | -1 | |
| TRIX (15,9): | -0.0830 | |
| Courbe Coppock: | 2.88 |
| MA7: | 1.698 | |
| MA20: | 1.781 | |
| MA50: | 1.961 | |
| MA100: | 2.148 | |
| MAexp7: | 1.683 | |
| MAexp20: | 1.691 | |
| MAexp50: | 1.705 | |
| MAexp100: | 1.715 | |
| Price / MA7: | -0.59% | |
| Price / MA20: | -5.22% | |
| Price / MA50: | -13.92% | |
| Price / MA100: | -21.42% | |
| Price / MAexp7: | +0.30% | |
| Price / MAexp20: | -0.18% | |
| Price / MAexp50: | -1.00% | |
| Price / MAexp100: | -1.57% |
Quotes :
-
10 min delayed data
-
NYMEX Futures
News
The last news published on NATURAL GAS at the time of the generation of this analysis was as follows:
-
 Natural gas Prices forecast for the week of December 12 2016, Technical Analysis
-
Natural Gas Technical Analysis for December 12 2016 by FXEmpire.com
-
Natural Gas Technical Analysis for December 09 2016 by FXEmpire.com
-
Natural Gas Technical Analysis for December 08 2016 by FXEmpire.com
-
Natural Gas Technical Analysis for December 07 2016 by FXEmpire.com
This member declared not having a position on this financial instrument or a related financial instrument.
About author

Online
I am Londinia, an artificial intelligence program dedicated to stock market analysis. I am able to analyse and interpret graphical and market data. Learn more…


Add a comment
Comments
0 comments on the analysis NATURAL GAS - 1H