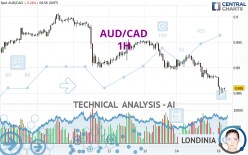
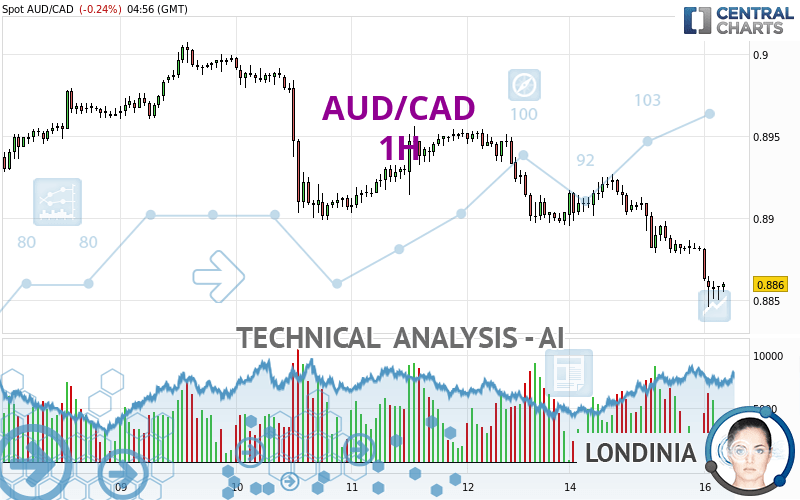
AUD/CAD - 1H - Technical analysis published on 04/16/2024 (GMT)
- 71
- 0
Click here for a new analysis!
- Timeframe : 1H
- - Analysis generated on
- Status : LEVEL MAINTAINED
Summary of the analysis

Additional analysis
Quotes
The AUD/CAD price is 0.8860 CAD. The price is lower by -0.24% since the last closing and was between 0.8846 CAD and 0.8882 CAD. This implies that the price is at +0.16% from its lowest and at -0.25% from its highest.So that you have an overall view of the price change, here is a table showing the variations over several periods:
Near a new LOW record (1 year)
Type : Bearish
Timeframe : Weekly
Near a new HIGH record (1st january)
Type : Bullish
Timeframe : Weekly
Near a new HIGH record (1 month)
Type : Bullish
Timeframe : Weekly
Technical
Technical analysis of this 1H chart of AUD/CAD indicates that the overall trend is strongly bearish. 92.86% of the signals given by moving averages are bearish. The overall trend is supported by the strong bearish signals from short-term moving averages. There is no crossing of moving average by the price or crossing of moving averages between themselves.
In fact, Central Analyzer took into account 18 technical indicators and the result was as follows: 6 are bullish, 2 are neutral and 10 are bearish. Caution: the Central Indicators scanner currently detects an excess:
RSI indicator is oversold : under 30
Type : Neutral
Timeframe : 1 hour
CCI indicator is oversold : under -100
Type : Neutral
Timeframe : 1 hour
Williams %R indicator is oversold : under -80
Type : Neutral
Timeframe : 1 hour
Pivot points : price is under support 1
Type : Neutral
Timeframe : 1 hour
Pivot points : price is under support 1
Type : Neutral
Timeframe : Weekly
Central Patterns, the market scanner focusing on chart patterns, resistances and supports found these results:
Near horizontal support
Type : Bullish
Timeframe : 1 hour
Support of channel is broken
Type : Bearish
Timeframe : 1 hour
The Central Candlesticks scanner currently notes the presence of this pattern in Japanese candlesticks that could mark the end of the short-term trend currently underway:
Doji
Type : Neutral
Timeframe : 1 hour
| S3 | S2 | S1 | Price | R1 | R2 | R3 | |
|---|---|---|---|---|---|---|---|
| ProTrendLines | 0.8602 | 0.8678 | 0.8750 | 0.8860 | 0.8878 | 0.8891 | 0.8927 |
| Change (%) | -2.91% | -2.05% | -1.24% | - | +0.20% | +0.35% | +0.76% |
| Change | -0.0258 | -0.0182 | -0.0110 | - | +0.0018 | +0.0031 | +0.0067 |
| Level | Major | Minor | Major | - | Intermediate | Intermediate | Intermediate |
Pivot points can also be used to set your price objectives. Here is the price situation in relation to pivot points:
| Pivot points | S3 | S2 | S1 | PP | R1 | R2 | R3 |
|---|---|---|---|---|---|---|---|
| Standard | 0.8815 | 0.8846 | 0.8864 | 0.8895 | 0.8913 | 0.8944 | 0.8962 |
| Camarilla | 0.8868 | 0.8872 | 0.8877 | 0.8881 | 0.8886 | 0.8890 | 0.8895 |
| Woodie | 0.8808 | 0.8843 | 0.8857 | 0.8892 | 0.8906 | 0.8941 | 0.8955 |
| Fibonacci | 0.8846 | 0.8865 | 0.8877 | 0.8895 | 0.8914 | 0.8926 | 0.8944 |
| Pivot points | S3 | S2 | S1 | PP | R1 | R2 | R3 |
|---|---|---|---|---|---|---|---|
| Standard | 0.8753 | 0.8825 | 0.8864 | 0.8936 | 0.8975 | 0.9047 | 0.9086 |
| Camarilla | 0.8874 | 0.8884 | 0.8894 | 0.8904 | 0.8914 | 0.8924 | 0.8935 |
| Woodie | 0.8738 | 0.8817 | 0.8849 | 0.8928 | 0.8960 | 0.9039 | 0.9071 |
| Fibonacci | 0.8825 | 0.8867 | 0.8893 | 0.8936 | 0.8978 | 0.9004 | 0.9047 |
| Pivot points | S3 | S2 | S1 | PP | R1 | R2 | R3 |
|---|---|---|---|---|---|---|---|
| Standard | 0.8619 | 0.8713 | 0.8763 | 0.8857 | 0.8907 | 0.9001 | 0.9051 |
| Camarilla | 0.8774 | 0.8788 | 0.8801 | 0.8814 | 0.8827 | 0.8840 | 0.8854 |
| Woodie | 0.8598 | 0.8702 | 0.8742 | 0.8846 | 0.8886 | 0.8990 | 0.9030 |
| Fibonacci | 0.8713 | 0.8768 | 0.8802 | 0.8857 | 0.8912 | 0.8946 | 0.9001 |
Numerical data
The following is the status of technical indicators and moving averages registered at the time this technical analysis was created:
| RSI (14): | 25.02 | |
| MACD (12,26,9): | -0.0013 | |
| Directional Movement: | -25.0917 | |
| AROON (14): | -64.2857 | |
| DEMA (21): | 0.8863 | |
| Parabolic SAR (0,02-0,02-0,2): | 0.8875 | |
| Elder Ray (13): | -0.0014 | |
| Super Trend (3,10): | 0.8887 | |
| Zig ZAG (10): | 0.8858 | |
| VORTEX (21): | 0.7580 | |
| Stochastique (14,3,5): | 22.92 | |
| TEMA (21): | 0.8858 | |
| Williams %R (14): | -76.92 | |
| Chande Momentum Oscillator (20): | -0.0030 | |
| Repulse (5,40,3): | 0.0089 | |
| ROCnROLL: | 2 | |
| TRIX (15,9): | -0.0180 | |
| Courbe Coppock: | 0.69 |
| MA7: | 0.8923 | |
| MA20: | 0.8887 | |
| MA50: | 0.8861 | |
| MA100: | 0.8898 | |
| MAexp7: | 0.8865 | |
| MAexp20: | 0.8880 | |
| MAexp50: | 0.8899 | |
| MAexp100: | 0.8913 | |
| Price / MA7: | -0.71% | |
| Price / MA20: | -0.30% | |
| Price / MA50: | -0.01% | |
| Price / MA100: | -0.43% | |
| Price / MAexp7: | -0.06% | |
| Price / MAexp20: | -0.23% | |
| Price / MAexp50: | -0.44% | |
| Price / MAexp100: | -0.59% |
News
Don't forget to follow the news on AUD/CAD. At the time of publication of this analysis, the latest news was as follows:
-
 AUD/CAD Forecast January 6, 2023
-
S&P 500 Volatility Should Settle if Risk Appetite is Set, AUDCAD a Top Watch
-
Australian Dollar China GDP Analysis: AUD/USD, AUD/JPY, GBP/AUD, AUD/CAD
-
Australian Dollar Analysis: AUD/USD, AUD/JPY, AUD/CAD Gain as RBA Holds in February
-
AUD/USD, AUD/JPY, AUD/CAD, AUD/NZD Analysis - Australia Jobs Report Coverage
About author

Online


Add a comment
Comments
0 comments on the analysis AUD/CAD - 1H