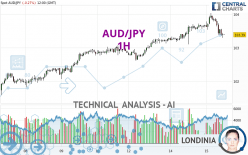
AUD/JPY - 1H - Technical analysis published on 05/15/2024 (GMT)
- 53
- 0
Click here for a new analysis!
- Timeframe : 1H
- - Analysis generated on
- Status : TARGET REACHED

Summary of the analysis

Additional analysis
Quotes
The AUD/JPY price is 103.39 JPY. On the day, this instrument lost -0.27% with the lowest point at 103.30 JPY and the highest point at 104.04 JPY. The deviation from the price is +0.09% for the low point and -0.62% for the high point.The Central Gaps scanner detects a bullish opening marking the presence of buyers ahead of sellers at the opening but not sufficiently marked to allow the price to register a quotation gap.
Bullish opening
Type : Bullish
Timeframe : Openning
Here is a more detailed summary of the historical variations registered by AUD/JPY:
Near a new HIGH record (5 years)
Type : Bullish
Timeframe : Weekly
Near a new HIGH record (1 year)
Type : Bullish
Timeframe : Weekly
Near a new HIGH record (1st january)
Type : Bullish
Timeframe : Weekly
Near a new HIGH record (1 month)
Type : Bullish
Timeframe : Weekly
Technical
A technical analysis in 1H of this AUD/JPY chart shows a slightly bullish trend. 57.14% of the signals given by moving averages are bullish. Caution: a reversal of the trend could be possible given the strong bearish signals of short-term moving averages. The Central Indicators scanner detects a bearish signal on moving averages that could impact this trend:
Bearish trend reversal : adaptative moving average 50
Type : Bearish
Timeframe : 1 hour
In fact, according to the parameters integrated into the Central Analyzer system, 11 technical indicators out of 18 analysed are currently bearish. Caution: the Central Indicators scanner currently detects an excess:
CCI indicator is oversold : under -100
Type : Neutral
Timeframe : 1 hour
RSI indicator: bullish divergence
Type : Bullish
Timeframe : 1 hour
Williams %R indicator is oversold : under -80
Type : Neutral
Timeframe : 1 hour
The Central Patterns scanner, which studies chart patterns, resistances and supports, has identified these signals:
Near horizontal support
Type : Bullish
Timeframe : 1 hour
Support of channel is broken
Type : Bearish
Timeframe : 1 hour
There is also a Japanese candlestick pattern detected by Central Candlesticks that could mark the end of the current short-term trend:
White hanging man / hammer
Type : Neutral
Timeframe : 1 hour
| S3 | S2 | S1 | Price | R1 | R2 | R3 | |
|---|---|---|---|---|---|---|---|
| ProTrendLines | 101.58 | 102.47 | 103.09 | 103.39 | 103.45 | 103.72 | 105.04 |
| Change (%) | -1.75% | -0.89% | -0.29% | - | +0.06% | +0.32% | +1.60% |
| Change | -1.81 | -0.92 | -0.30 | - | +0.06 | +0.33 | +1.65 |
| Level | Minor | Intermediate | Intermediate | - | Intermediate | Intermediate | Intermediate |
Attention could also be paid to pivot points to set price objectives:
| Pivot points | S3 | S2 | S1 | PP | R1 | R2 | R3 |
|---|---|---|---|---|---|---|---|
| Standard | 102.65 | 102.88 | 103.27 | 103.50 | 103.89 | 104.12 | 104.51 |
| Camarilla | 103.50 | 103.56 | 103.61 | 103.67 | 103.73 | 103.78 | 103.84 |
| Woodie | 102.74 | 102.92 | 103.36 | 103.54 | 103.98 | 104.16 | 104.60 |
| Fibonacci | 102.88 | 103.11 | 103.26 | 103.50 | 103.73 | 103.88 | 104.12 |
| Pivot points | S3 | S2 | S1 | PP | R1 | R2 | R3 |
|---|---|---|---|---|---|---|---|
| Standard | 99.41 | 100.18 | 101.52 | 102.29 | 103.63 | 104.40 | 105.74 |
| Camarilla | 102.27 | 102.46 | 102.66 | 102.85 | 103.04 | 103.24 | 103.43 |
| Woodie | 99.69 | 100.32 | 101.80 | 102.43 | 103.91 | 104.54 | 106.02 |
| Fibonacci | 100.18 | 100.99 | 101.49 | 102.29 | 103.10 | 103.60 | 104.40 |
| Pivot points | S3 | S2 | S1 | PP | R1 | R2 | R3 |
|---|---|---|---|---|---|---|---|
| Standard | 91.12 | 94.45 | 98.30 | 101.63 | 105.48 | 108.81 | 112.66 |
| Camarilla | 100.18 | 100.83 | 101.49 | 102.15 | 102.81 | 103.47 | 104.13 |
| Woodie | 91.38 | 94.58 | 98.56 | 101.76 | 105.74 | 108.94 | 112.92 |
| Fibonacci | 94.45 | 97.19 | 98.89 | 101.63 | 104.37 | 106.07 | 108.81 |
Numerical data
The following are the details of the technical indicators and moving averages that were collected to generate this technical analysis:
| RSI (14): | 41.51 | |
| MACD (12,26,9): | 0.0200 | |
| Directional Movement: | -13.25 | |
| AROON (14): | -57.14 | |
| DEMA (21): | 103.66 | |
| Parabolic SAR (0,02-0,02-0,2): | 103.99 | |
| Elder Ray (13): | -0.23 | |
| Super Trend (3,10): | 103.87 | |
| Zig ZAG (10): | 103.40 | |
| VORTEX (21): | 0.9300 | |
| Stochastique (14,3,5): | 13.71 | |
| TEMA (21): | 103.57 | |
| Williams %R (14): | -86.49 | |
| Chande Momentum Oscillator (20): | -0.28 | |
| Repulse (5,40,3): | -0.1700 | |
| ROCnROLL: | -1 | |
| TRIX (15,9): | 0.0100 | |
| Courbe Coppock: | 0.12 |
| MA7: | 102.88 | |
| MA20: | 101.76 | |
| MA50: | 100.00 | |
| MA100: | 98.67 | |
| MAexp7: | 103.53 | |
| MAexp20: | 103.60 | |
| MAexp50: | 103.44 | |
| MAexp100: | 103.14 | |
| Price / MA7: | +0.50% | |
| Price / MA20: | +1.60% | |
| Price / MA50: | +3.39% | |
| Price / MA100: | +4.78% | |
| Price / MAexp7: | -0.14% | |
| Price / MAexp20: | -0.20% | |
| Price / MAexp50: | -0.05% | |
| Price / MAexp100: | +0.24% |
News
Don't forget to follow the news on AUD/JPY. At the time of publication of this analysis, the latest news was as follows:
-
 AUD/JPY Forecast January 6, 2023
-
AUD/JPY Forecast December 16, 2022
-
Risk event for the week: Long #AUDJPY
-
Trade of the Week: long AUD/JPY
-
Market Sentiment Webinar: Positive for USD, Bullish Signal on AUD/JPY
About author

Online


Add a comment
Comments
0 comments on the analysis AUD/JPY - 1H