CAD/MXN - 1H - Technical analysis published on 03/28/2024 (GMT)
- 120
- 0
Click here for a new analysis!
- Timeframe : 1H
- - Analysis generated on
- Status : LEVEL MAINTAINED

Summary of the analysis

Additional analysis
Quotes
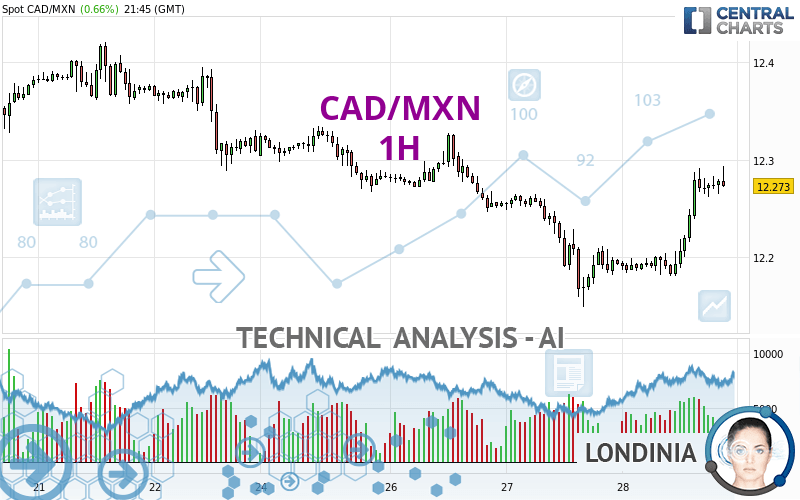
The CAD/MXN rating is 12.273 MXN. The price has increased by +0.66% since the last closing and was traded between 12.181 MXN and 12.294 MXN over the period. The price is currently at +0.76% from its lowest and -0.17% from its highest.The Central Gaps scanner detects a bullish opening. A small advantage for buyers in the very short term.
Bullish opening
Type : Bullish
Timeframe : Openning
Here is a more detailed summary of the historical variations registered by CAD/MXN:
New LOW record (5 years)
Type : Bearish
Timeframe : Weekly
Near a new LOW record (1 year)
Type : Bearish
Timeframe : Weekly
Near a new HIGH record (1st january)
Type : Bullish
Timeframe : Weekly
Near a new HIGH record (1 month)
Type : Bullish
Timeframe : Weekly
Technical
Technical analysis of this 1H chart of CAD/MXN indicates that the overall trend is bullish. The signals returned by the moving averages are 67.86% bullish. This bullish trend is reinforced by the strong signals currently being given by short-term moving averages. The Central Indicators scanner detects bullish signals on moving averages that could impact this trend:
Bullish trend reversal : Moving Average 50
Type : Bullish
Timeframe : 1 hour
Moving Average bullish crossovers : MA20 & MA50
Type : Bullish
Timeframe : 1 hour
An assessment of technical indicators shows a strong bullish signal.
But beware of excesses. The Central Indicators scanner currently detects this:
CCI indicator is overbought : over 100
Type : Neutral
Timeframe : 1 hour
RSI indicator: bearish divergence
Type : Bearish
Timeframe : 1 hour
Williams %R indicator is overbought : over -20
Type : Neutral
Timeframe : 1 hour
Pivot points : price is over resistance 1
Type : Neutral
Timeframe : 1 hour
An analysis of the price chart with the Central Patterns scanner (detector of chart patterns and resistances and supports) shows a result that can have an impact on the price change:
Resistance of channel is broken
Type : Bullish
Timeframe : 1 hour
No result was found by the Central Candlesticks scanner on Japanese candlesticks.
| S3 | S2 | S1 | Price | R1 | R2 | R3 | |
|---|---|---|---|---|---|---|---|
| ProTrendLines | 11.700 | 12.149 | 12.212 | 12.273 | 12.316 | 12.421 | 12.491 |
| Change (%) | -4.67% | -1.01% | -0.50% | - | +0.35% | +1.21% | +1.78% |
| Change | -0.573 | -0.124 | -0.061 | - | +0.043 | +0.148 | +0.218 |
| Level | Major | Intermediate | Minor | - | Intermediate | Minor | Minor |
To determine price objectives, it is also possible to use the pivot points. Here is the price position in relation to pivot points:
| Pivot points | S3 | S2 | S1 | PP | R1 | R2 | R3 |
|---|---|---|---|---|---|---|---|
| Standard | 12.024 | 12.086 | 12.140 | 12.202 | 12.256 | 12.318 | 12.372 |
| Camarilla | 12.161 | 12.172 | 12.182 | 12.193 | 12.204 | 12.214 | 12.225 |
| Woodie | 12.019 | 12.084 | 12.135 | 12.200 | 12.251 | 12.316 | 12.367 |
| Fibonacci | 12.086 | 12.131 | 12.158 | 12.202 | 12.247 | 12.274 | 12.318 |
| Pivot points | S3 | S2 | S1 | PP | R1 | R2 | R3 |
|---|---|---|---|---|---|---|---|
| Standard | 12.033 | 12.161 | 12.235 | 12.363 | 12.437 | 12.565 | 12.639 |
| Camarilla | 12.254 | 12.272 | 12.291 | 12.309 | 12.328 | 12.346 | 12.365 |
| Woodie | 12.006 | 12.148 | 12.208 | 12.350 | 12.410 | 12.552 | 12.612 |
| Fibonacci | 12.161 | 12.238 | 12.286 | 12.363 | 12.440 | 12.488 | 12.565 |
| Pivot points | S3 | S2 | S1 | PP | R1 | R2 | R3 |
|---|---|---|---|---|---|---|---|
| Standard | 12.178 | 12.366 | 12.466 | 12.654 | 12.754 | 12.942 | 13.042 |
| Camarilla | 12.487 | 12.513 | 12.540 | 12.566 | 12.592 | 12.619 | 12.645 |
| Woodie | 12.134 | 12.344 | 12.422 | 12.632 | 12.710 | 12.920 | 12.998 |
| Fibonacci | 12.366 | 12.476 | 12.544 | 12.654 | 12.764 | 12.832 | 12.942 |
Numerical data
The following is the status of the technical indicators and moving averages at the time of publication of this technical analysis:
| RSI (14): | 68.37 | |
| MACD (12,26,9): | 0.0180 | |
| Directional Movement: | 22.122 | |
| AROON (14): | 78.571 | |
| DEMA (21): | 12.259 | |
| Parabolic SAR (0,02-0,02-0,2): | 12.259 | |
| Elder Ray (13): | 0.032 | |
| Super Trend (3,10): | 12.223 | |
| Zig ZAG (10): | 12.277 | |
| VORTEX (21): | 1.2230 | |
| Stochastique (14,3,5): | 84.49 | |
| TEMA (21): | 12.281 | |
| Williams %R (14): | -16.81 | |
| Chande Momentum Oscillator (20): | 0.084 | |
| Repulse (5,40,3): | -0.0050 | |
| ROCnROLL: | 1 | |
| TRIX (15,9): | 0.0110 | |
| Courbe Coppock: | 1.27 |
| MA7: | 12.296 | |
| MA20: | 12.395 | |
| MA50: | 12.576 | |
| MA100: | 12.649 | |
| MAexp7: | 12.266 | |
| MAexp20: | 12.240 | |
| MAexp50: | 12.236 | |
| MAexp100: | 12.260 | |
| Price / MA7: | -0.19% | |
| Price / MA20: | -0.98% | |
| Price / MA50: | -2.41% | |
| Price / MA100: | -2.97% | |
| Price / MAexp7: | +0.06% | |
| Price / MAexp20: | +0.27% | |
| Price / MAexp50: | +0.30% | |
| Price / MAexp100: | +0.11% |
News
Don't forget to follow the news on CAD/MXN. At the time of publication of this analysis, the latest news was as follows:
About author
Online


Add a comment
Comments
0 comments on the analysis CAD/MXN - 1H