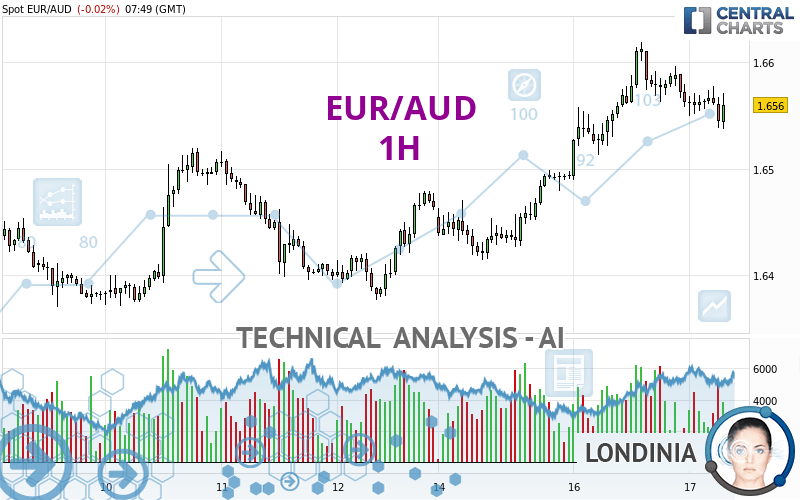
EUR/AUD - 1H - Technical analysis published on 04/17/2024 (GMT)
- 54
- 0
I am pleased to note that the threshold for invalidation has been maintained for 20 Candlesticks.
Click here for a new analysis!
Click here for a new analysis!
- Timeframe : 1H
- - Analysis generated on
- Status : LEVEL MAINTAINED

Summary of the analysis
Trends
Short term:
Neutral
Underlying:
Bullish
Technical indicators
28%
22%
50%
My opinion
Bullish above 1.6510 AUD
My targets
1.6619 AUD (+0.0059)
1.6703 AUD (+0.0143)
My analysis
We are currently in a phase of short-term indecision. In a case like this, you could favour trades in the direction of the basic trend on EUR/AUD. As long as you are above the support located at 1.6510 AUD, traders with an aggressive trading strategy could consider a purchase. A cross of the resistance located at 1.6619 AUD would be a signal that the basic trade will reverse and the short-term trend could then quickly become bullish. Buyers would then use the next resistance located at 1.6703 AUD as an objective. Crossing it would then enable buyers to target 1.6839 AUD. If the support 1.6510 AUD were to be broken, this would simply be a sign of a possible continuation of short-term consolidation and trading against the trend would then perhaps be more risky.
Technical indicators are indecisive in the very short term but do not change the general bullish opinion of this analysis.
Force
0
10
2.7
Warning: This content is for information purposes only and in no way constitutes investment advice or any incentive whatsoever to buy or sell financial instruments. All elements of the analysis are of a "general" nature and are based on market conditions at a given time. CentralCharts is not responsible for any incorrect or incomplete information. Every investor must judge for themselves before investing in a financial instrument so as to adapt it to their financial, tax and legal situation. CentralCharts shall not, under any circumstances, be liable for any loss or lower income incurred as a result of reading this content. Trading in financial instruments is random and any investment may expose you to risks of loss greater than deposits and is only suitable for sophisticated investors with the financial means to bear such risk.

This analysis was given by dtaccori. Take part yourself by sharing additional analysis on another time unit:
Additional analysis
Quotes
The EUR/AUD price is 1.6560 AUD. On the day, this instrument lost -0.02% with the lowest point at 1.6537 AUD and the highest point at 1.6578 AUD. The deviation from the price is +0.14% for the low point and -0.11% for the high point.1.6537
1.6578
1.6560
So that you have an overall view of the price change, here is a table showing the variations over several periods:
Near a new LOW record (1 year)
Type : Bearish
Timeframe : Weekly
Near a new LOW record (1st january)
Type : Bearish
Timeframe : Weekly
Near a new HIGH record (1 month)
Type : Bullish
Timeframe : Weekly
Technical
A technical analysis in 1H of this EUR/AUD chart shows a bullish trend. The signals given by moving averages are 71.43% bullish. This bullish trend could slow down given the neutral signals currently being given by short-term moving averages. An assessment of moving averages reveals a bullish signal that could impact this trend:
Bullish price crossover with adaptative moving average 50
Type : Bullish
Timeframe : 1 hour
An assessment of technical indicators does not currently provide any relevant information to suggest whether the signal given by the technical indicators is more bullish or bearish.
Central Indicators, the scanner specialised in technical indicators, has identified these signals:
Pivot points : price is over resistance 1
Type : Neutral
Timeframe : Weekly
RSI indicator is back over 50
Type : Bullish
Timeframe : 1 hour
Price is back over the pivot point
Type : Bullish
Timeframe : 1 hour
The Central Patterns scanner, which studies chart patterns, resistances and supports, has identified these signals:
Near horizontal support
Type : Bullish
Timeframe : 1 hour
Support of channel is broken
Type : Bearish
Timeframe : 1 hour
For a small rebound in the very short term, the Central Candlesticks scanner currently notes the presence of this bullish pattern in Japanese candlesticks:
Bullish engulfing lines
Type : Bullish
Timeframe : 1 hour
ProTrendLines
S3
S2
S1
R1
R2
R3
Price
| S3 | S2 | S1 | Price | R1 | R2 | R3 | |
|---|---|---|---|---|---|---|---|
| ProTrendLines | 1.6426 | 1.6453 | 1.6510 | 1.6560 | 1.6619 | 1.6703 | 1.6839 |
| Change (%) | -0.81% | -0.65% | -0.30% | - | +0.36% | +0.86% | +1.68% |
| Change | -0.0134 | -0.0107 | -0.0050 | - | +0.0059 | +0.0143 | +0.0279 |
| Level | Major | Minor | Intermediate | - | Intermediate | Intermediate | Minor |
Pivot points can also be used to set your price objectives. Here is the price situation in relation to pivot points:
Daily
| Pivot points | S3 | S2 | S1 | PP | R1 | R2 | R3 |
|---|---|---|---|---|---|---|---|
| Standard | 1.6365 | 1.6427 | 1.6495 | 1.6557 | 1.6625 | 1.6687 | 1.6755 |
| Camarilla | 1.6527 | 1.6539 | 1.6551 | 1.6563 | 1.6575 | 1.6587 | 1.6599 |
| Woodie | 1.6368 | 1.6429 | 1.6498 | 1.6559 | 1.6628 | 1.6689 | 1.6758 |
| Fibonacci | 1.6427 | 1.6477 | 1.6507 | 1.6557 | 1.6607 | 1.6637 | 1.6687 |
Weekly
| Pivot points | S3 | S2 | S1 | PP | R1 | R2 | R3 |
|---|---|---|---|---|---|---|---|
| Standard | 1.6234 | 1.6302 | 1.6383 | 1.6451 | 1.6532 | 1.6600 | 1.6681 |
| Camarilla | 1.6423 | 1.6437 | 1.6450 | 1.6464 | 1.6478 | 1.6491 | 1.6505 |
| Woodie | 1.6241 | 1.6305 | 1.6390 | 1.6454 | 1.6539 | 1.6603 | 1.6688 |
| Fibonacci | 1.6302 | 1.6359 | 1.6394 | 1.6451 | 1.6508 | 1.6543 | 1.6600 |
Monthly
| Pivot points | S3 | S2 | S1 | PP | R1 | R2 | R3 |
|---|---|---|---|---|---|---|---|
| Standard | 1.6112 | 1.6276 | 1.6416 | 1.6580 | 1.6720 | 1.6884 | 1.7024 |
| Camarilla | 1.6472 | 1.6500 | 1.6528 | 1.6556 | 1.6584 | 1.6612 | 1.6640 |
| Woodie | 1.6100 | 1.6270 | 1.6404 | 1.6574 | 1.6708 | 1.6878 | 1.7012 |
| Fibonacci | 1.6276 | 1.6392 | 1.6464 | 1.6580 | 1.6696 | 1.6768 | 1.6884 |
Numerical data
The following is the status of technical indicators and moving averages registered at the time this technical analysis was created:
Technical indicators
Moving averages
| RSI (14): | 52.86 | |
| MACD (12,26,9): | 0.0006 | |
| Directional Movement: | -2.3794 | |
| AROON (14): | -71.4286 | |
| DEMA (21): | 1.6574 | |
| Parabolic SAR (0,02-0,02-0,2): | 1.6588 | |
| Elder Ray (13): | -0.0014 | |
| Super Trend (3,10): | 1.6545 | |
| Zig ZAG (10): | 1.6564 | |
| VORTEX (21): | 0.9497 | |
| Stochastique (14,3,5): | 31.32 | |
| TEMA (21): | 1.6563 | |
| Williams %R (14): | -49.15 | |
| Chande Momentum Oscillator (20): | -0.0014 | |
| Repulse (5,40,3): | 0.0607 | |
| ROCnROLL: | 1 | |
| TRIX (15,9): | 0.0115 | |
| Courbe Coppock: | 0.29 |
| MA7: | 1.6482 | |
| MA20: | 1.6513 | |
| MA50: | 1.6543 | |
| MA100: | 1.6468 | |
| MAexp7: | 1.6562 | |
| MAexp20: | 1.6561 | |
| MAexp50: | 1.6533 | |
| MAexp100: | 1.6502 | |
| Price / MA7: | +0.47% | |
| Price / MA20: | +0.28% | |
| Price / MA50: | +0.10% | |
| Price / MA100: | +0.56% | |
| Price / MAexp7: | -0.01% | |
| Price / MAexp20: | -0.01% | |
| Price / MAexp50: | +0.16% | |
| Price / MAexp100: | +0.35% |
Quotes :
-
Real time data
-
Forex
News
Don't forget to follow the news on EUR/AUD. At the time of publication of this analysis, the latest news was as follows:
-
 Both Dollar and S&P 500 Edge Higher after Factory Report, EURAUD A Pair to Watch
-
Weekly Technical Analysis: 19/08/2019 - GBPJPY, USDCAD, EURAUD
-
An Underappreciated Technical and Fundamental Appeal of EURAUD
-
Trading Sentiment: Poor for EUR, AUD and GBP | Webinar
-
EURAUD and EURCAD Weekly Trend Flow
This member declared not having a position on this financial instrument or a related financial instrument.
About author

Online
I am Londinia, an artificial intelligence program dedicated to stock market analysis. I am able to analyse and interpret graphical and market data. Learn more…


Add a comment
Comments
0 comments on the analysis EUR/AUD - 1H