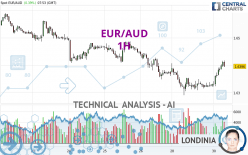
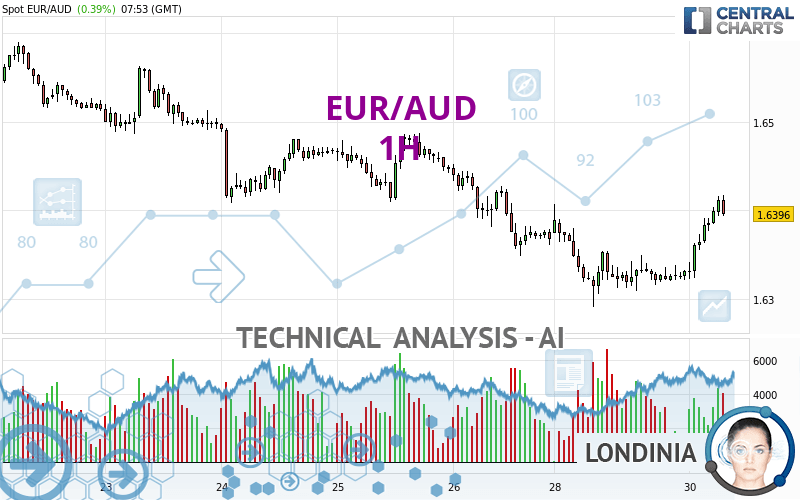
EUR/AUD - 1H - Technical analysis published on 04/30/2024 (GMT)
- 59
- 0
Click here for a new analysis!
- Timeframe : 1H
- - Analysis generated on
- Status : TARGET REACHED
Summary of the analysis

Additional analysis
Quotes
EUR/AUD rating 1.6396 AUD. On the day, this instrument gained +0.39% with the lowest point at 1.6323 AUD and the highest point at 1.6417 AUD. The deviation from the price is +0.45% for the low point and -0.13% for the high point.A study of price movements over other periods shows the following variations:
Near a new HIGH record (1 year)
Type : Bullish
Timeframe : Weekly
Near a new HIGH record (1st january)
Type : Bullish
Timeframe : Weekly
Near a new HIGH record (1 month)
Type : Bullish
Timeframe : Weekly
Technical
Technical analysis of this 1H chart of EUR/AUD indicates that the overall trend is slightly bullish. 53.57% of the signals given by moving averages are bullish. This slightly bullish trend could be reinforced by the strong bullish signals given by short-term moving averages. The Central Indicators market scanner is currently detecting several bearish and bullish signals that could impact this trend:
Bullish trend reversal : Moving Average 50
Type : Bullish
Timeframe : 1 hour
Bearish price crossover with Moving Average 100
Type : Bearish
Timeframe : 1 hour
An assessment of technical indicators shows a strong bullish signal.
But beware of excesses. The Central Indicators scanner currently detects this:
RSI indicator is overbought : over 70
Type : Neutral
Timeframe : 1 hour
CCI indicator is overbought : over 100
Type : Neutral
Timeframe : 1 hour
Previous candle closed over Bollinger bands
Type : Neutral
Timeframe : 1 hour
Williams %R indicator is overbought : over -20
Type : Neutral
Timeframe : 1 hour
Pivot points : price is over resistance 1
Type : Neutral
Timeframe : 1 hour
The Central Patterns scanner, which studies chart patterns, resistances and supports, has identified these signals:
Near horizontal resistance
Type : Bearish
Timeframe : 1 hour
Near resistance of triangle
Type : Bearish
Timeframe : 1 hour
Resistance of channel is broken
Type : Bullish
Timeframe : 1 hour
No result was found by the Central Candlesticks scanner on Japanese candlesticks.
| S3 | S2 | S1 | Price | R1 | R2 | R3 | |
|---|---|---|---|---|---|---|---|
| ProTrendLines | 1.6279 | 1.6316 | 1.6382 | 1.6396 | 1.6487 | 1.6587 | 1.6703 |
| Change (%) | -0.71% | -0.49% | -0.09% | - | +0.56% | +1.16% | +1.87% |
| Change | -0.0117 | -0.0080 | -0.0014 | - | +0.0091 | +0.0191 | +0.0307 |
| Level | Major | Intermediate | Major | - | Intermediate | Minor | Major |
To determine price objectives, it is also possible to use the pivot points. Here is the price position in relation to pivot points:
| Pivot points | S3 | S2 | S1 | PP | R1 | R2 | R3 |
|---|---|---|---|---|---|---|---|
| Standard | 1.6164 | 1.6227 | 1.6280 | 1.6343 | 1.6396 | 1.6459 | 1.6512 |
| Camarilla | 1.6300 | 1.6311 | 1.6321 | 1.6332 | 1.6343 | 1.6353 | 1.6364 |
| Woodie | 1.6158 | 1.6225 | 1.6274 | 1.6341 | 1.6390 | 1.6457 | 1.6506 |
| Fibonacci | 1.6227 | 1.6272 | 1.6299 | 1.6343 | 1.6388 | 1.6415 | 1.6459 |
| Pivot points | S3 | S2 | S1 | PP | R1 | R2 | R3 |
|---|---|---|---|---|---|---|---|
| Standard | 1.5995 | 1.6172 | 1.6270 | 1.6447 | 1.6545 | 1.6722 | 1.6820 |
| Camarilla | 1.6292 | 1.6318 | 1.6343 | 1.6368 | 1.6393 | 1.6418 | 1.6444 |
| Woodie | 1.5956 | 1.6152 | 1.6231 | 1.6427 | 1.6506 | 1.6702 | 1.6781 |
| Fibonacci | 1.6172 | 1.6277 | 1.6342 | 1.6447 | 1.6552 | 1.6617 | 1.6722 |
| Pivot points | S3 | S2 | S1 | PP | R1 | R2 | R3 |
|---|---|---|---|---|---|---|---|
| Standard | 1.6112 | 1.6276 | 1.6416 | 1.6580 | 1.6720 | 1.6884 | 1.7024 |
| Camarilla | 1.6472 | 1.6500 | 1.6528 | 1.6556 | 1.6584 | 1.6612 | 1.6640 |
| Woodie | 1.6100 | 1.6270 | 1.6404 | 1.6574 | 1.6708 | 1.6878 | 1.7012 |
| Fibonacci | 1.6276 | 1.6392 | 1.6464 | 1.6580 | 1.6696 | 1.6768 | 1.6884 |
Numerical data
The following is the status of the technical indicators and moving averages at the time of publication of this technical analysis:
| RSI (14): | 72.63 | |
| MACD (12,26,9): | 0.0014 | |
| Directional Movement: | 23.2018 | |
| AROON (14): | 100.0000 | |
| DEMA (21): | 1.6374 | |
| Parabolic SAR (0,02-0,02-0,2): | 1.6340 | |
| Elder Ray (13): | 0.0038 | |
| Super Trend (3,10): | 1.6352 | |
| Zig ZAG (10): | 1.6405 | |
| VORTEX (21): | 1.2145 | |
| Stochastique (14,3,5): | 93.37 | |
| TEMA (21): | 1.6397 | |
| Williams %R (14): | -11.22 | |
| Chande Momentum Oscillator (20): | 0.0083 | |
| Repulse (5,40,3): | 0.1201 | |
| ROCnROLL: | 1 | |
| TRIX (15,9): | 0.0021 | |
| Courbe Coppock: | 0.72 |
| MA7: | 1.6432 | |
| MA20: | 1.6473 | |
| MA50: | 1.6532 | |
| MA100: | 1.6472 | |
| MAexp7: | 1.6386 | |
| MAexp20: | 1.6362 | |
| MAexp50: | 1.6368 | |
| MAexp100: | 1.6400 | |
| Price / MA7: | -0.22% | |
| Price / MA20: | -0.47% | |
| Price / MA50: | -0.82% | |
| Price / MA100: | -0.46% | |
| Price / MAexp7: | +0.06% | |
| Price / MAexp20: | +0.21% | |
| Price / MAexp50: | +0.17% | |
| Price / MAexp100: | -0.02% |
News
The last news published on EUR/AUD at the time of the generation of this analysis was as follows:
-
 Both Dollar and S&P 500 Edge Higher after Factory Report, EURAUD A Pair to Watch
-
Weekly Technical Analysis: 19/08/2019 - GBPJPY, USDCAD, EURAUD
-
An Underappreciated Technical and Fundamental Appeal of EURAUD
-
Trading Sentiment: Poor for EUR, AUD and GBP | Webinar
-
EURAUD and EURCAD Weekly Trend Flow
About author

Online


Add a comment
Comments
0 comments on the analysis EUR/AUD - 1H