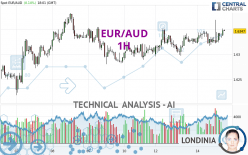
EUR/AUD - 1H - Technical analysis published on 05/14/2024 (GMT)
- 56
- 0
Click here for a new analysis!
- Timeframe : 1H
- - Analysis generated on
- Status : INVALID

Summary of the analysis

Additional analysis
Quotes
The EUR/AUD rating is 1.6347 AUD. The price registered an increase of +0.14% on the session with the lowest point at 1.6317 AUD and the highest point at 1.6369 AUD. The deviation from the price is +0.18% for the low point and -0.13% for the high point.A bearish opening was detected by the Central Gaps scanner. Sellers are trying to impose a bearish trend in the very short term.
Bearish opening
Type : Bearish
Timeframe : Openning
So that you have an overall view of the price change, here is a table showing the variations over several periods:
Near a new HIGH record (1 year)
Type : Bullish
Timeframe : Weekly
Near a new HIGH record (1st january)
Type : Bullish
Timeframe : Weekly
Near a new HIGH record (1 month)
Type : Bullish
Timeframe : Weekly
Technical
A technical analysis in 1H of this EUR/AUD chart shows a strongly bullish trend. 92.86% of the signals given by moving averages are bullish. This strongly bullish trend is supported by the strong bullish signals given by short-term moving averages. There is no crossing of moving average by the price or crossing of moving averages between themselves.
In fact, according to the parameters integrated into the Central Analyzer system, 12 technical indicators out of 18 analysed are currently bullish. Caution: the Central Indicators scanner currently detects an excess:
CCI indicator is overbought : over 100
Type : Neutral
Timeframe : 1 hour
MACD crosses UP its Moving Average
Type : Bullish
Timeframe : 1 hour
Price is back over the pivot point
Type : Bullish
Timeframe : Weekly
Momentum indicator is back over 0
Type : Bullish
Timeframe : 1 hour
Williams %R indicator is back over -50
Type : Bullish
Timeframe : 1 hour
Central Patterns, the market scanner focusing on chart patterns, resistances and supports found these results:
Near horizontal resistance
Type : Bearish
Timeframe : 1 hour
Near resistance of triangle
Type : Bearish
Timeframe : 1 hour
Resistance of channel is broken
Type : Bullish
Timeframe : 1 hour
The Central Candlesticks scanner which studies Japanese candlesticks did not detect anything.
| S3 | S2 | S1 | Price | R1 | R2 | R3 | |
|---|---|---|---|---|---|---|---|
| ProTrendLines | 1.6240 | 1.6279 | 1.6322 | 1.6347 | 1.6353 | 1.6382 | 1.6411 |
| Change (%) | -0.65% | -0.42% | -0.15% | - | +0.04% | +0.21% | +0.39% |
| Change | -0.0107 | -0.0068 | -0.0025 | - | +0.0006 | +0.0035 | +0.0064 |
| Level | Minor | Major | Minor | - | Major | Major | Minor |
Pivot points can also be used to set your price objectives. Here is the price situation in relation to pivot points:
| Pivot points | S3 | S2 | S1 | PP | R1 | R2 | R3 |
|---|---|---|---|---|---|---|---|
| Standard | 1.6240 | 1.6268 | 1.6296 | 1.6324 | 1.6352 | 1.6380 | 1.6408 |
| Camarilla | 1.6309 | 1.6314 | 1.6319 | 1.6324 | 1.6329 | 1.6334 | 1.6339 |
| Woodie | 1.6240 | 1.6268 | 1.6296 | 1.6324 | 1.6352 | 1.6380 | 1.6408 |
| Fibonacci | 1.6268 | 1.6289 | 1.6303 | 1.6324 | 1.6345 | 1.6359 | 1.6380 |
| Pivot points | S3 | S2 | S1 | PP | R1 | R2 | R3 |
|---|---|---|---|---|---|---|---|
| Standard | 1.6062 | 1.6140 | 1.6227 | 1.6305 | 1.6392 | 1.6470 | 1.6557 |
| Camarilla | 1.6269 | 1.6284 | 1.6299 | 1.6314 | 1.6329 | 1.6344 | 1.6359 |
| Woodie | 1.6067 | 1.6142 | 1.6232 | 1.6307 | 1.6397 | 1.6472 | 1.6562 |
| Fibonacci | 1.6140 | 1.6203 | 1.6242 | 1.6305 | 1.6368 | 1.6407 | 1.6470 |
| Pivot points | S3 | S2 | S1 | PP | R1 | R2 | R3 |
|---|---|---|---|---|---|---|---|
| Standard | 1.5891 | 1.6091 | 1.6282 | 1.6482 | 1.6673 | 1.6873 | 1.7064 |
| Camarilla | 1.6366 | 1.6401 | 1.6437 | 1.6473 | 1.6509 | 1.6545 | 1.6581 |
| Woodie | 1.5887 | 1.6089 | 1.6278 | 1.6480 | 1.6669 | 1.6871 | 1.7060 |
| Fibonacci | 1.6091 | 1.6240 | 1.6333 | 1.6482 | 1.6631 | 1.6724 | 1.6873 |
Numerical data
The following are the details of the technical indicators and moving averages that were collected to generate this technical analysis:
| RSI (14): | 62.02 | |
| MACD (12,26,9): | 0.0004 | |
| Directional Movement: | 14.4541 | |
| AROON (14): | 28.5714 | |
| DEMA (21): | 1.6338 | |
| Parabolic SAR (0,02-0,02-0,2): | 1.6322 | |
| Elder Ray (13): | 0.0009 | |
| Super Trend (3,10): | 1.6309 | |
| Zig ZAG (10): | 1.6350 | |
| VORTEX (21): | 1.0328 | |
| Stochastique (14,3,5): | 46.79 | |
| TEMA (21): | 1.6339 | |
| Williams %R (14): | -34.62 | |
| Chande Momentum Oscillator (20): | 0.0008 | |
| Repulse (5,40,3): | 0.1006 | |
| ROCnROLL: | 1 | |
| TRIX (15,9): | 0.0024 | |
| Courbe Coppock: | 0.00 |
| MA7: | 1.6313 | |
| MA20: | 1.6403 | |
| MA50: | 1.6479 | |
| MA100: | 1.6474 | |
| MAexp7: | 1.6338 | |
| MAexp20: | 1.6334 | |
| MAexp50: | 1.6328 | |
| MAexp100: | 1.6325 | |
| Price / MA7: | +0.21% | |
| Price / MA20: | -0.34% | |
| Price / MA50: | -0.80% | |
| Price / MA100: | -0.77% | |
| Price / MAexp7: | +0.06% | |
| Price / MAexp20: | +0.08% | |
| Price / MAexp50: | +0.12% | |
| Price / MAexp100: | +0.13% |
News
Don't forget to follow the news on EUR/AUD. At the time of publication of this analysis, the latest news was as follows:
-
 Both Dollar and S&P 500 Edge Higher after Factory Report, EURAUD A Pair to Watch
-
Weekly Technical Analysis: 19/08/2019 - GBPJPY, USDCAD, EURAUD
-
An Underappreciated Technical and Fundamental Appeal of EURAUD
-
Trading Sentiment: Poor for EUR, AUD and GBP | Webinar
-
EURAUD and EURCAD Weekly Trend Flow
About author

Online


Add a comment
Comments
0 comments on the analysis EUR/AUD - 1H