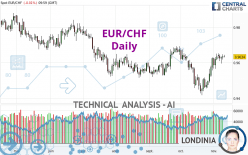
EUR/CHF - Daily - Technical analysis published on 11/10/2023 (GMT)
- 79
- 0
Oops, I was wrong about that analysis. My threshold for invalidation has been broken.
Click here for a new analysis!
Click here for a new analysis!
- Timeframe : Daily
- - Analysis generated on
- Status : INVALID
Summary of the analysis
Trends
Short term:
Strongly bullish
Underlying:
Bullish
Technical indicators
67%
6%
28%
My opinion
Bullish above 0.9537 CHF
My targets
0.9680 CHF (+0.0046)
0.9786 CHF (+0.0152)
My analysis
In the short term, there could be an acceleration of the basic bullish trend on EUR/CHF. This is a positive signal for buyers. As long as the price remains above 0.9537 CHF, a purchase could be considered. The first bullish objective is located at 0.9680 CHF. The bullish momentum would be boosted by a break in this resistance. Buyers would then use the next resistance located at 0.9786 CHF as an objective. Crossing it would then enable buyers to target 0.9861 CHF. In the event of a return below 0.9537 CHF, the price would probably only initiate a small short-term correction to improve the bullish trend. Trading this correction may be risky.
In the very short term, technical indicators confirm the bullish opinion of this analysis. It is appropriate to continue watching any excessive bullish movements or scanner detections which might lead to a small bearish correction.
Force
0
10
5.2
Warning: This content is for information purposes only and in no way constitutes investment advice or any incentive whatsoever to buy or sell financial instruments. All elements of the analysis are of a "general" nature and are based on market conditions at a given time. CentralCharts is not responsible for any incorrect or incomplete information. Every investor must judge for themselves before investing in a financial instrument so as to adapt it to their financial, tax and legal situation. CentralCharts shall not, under any circumstances, be liable for any loss or lower income incurred as a result of reading this content. Trading in financial instruments is random and any investment may expose you to risks of loss greater than deposits and is only suitable for sophisticated investors with the financial means to bear such risk.

This analysis was given by hannahfreeman. Take part yourself by sharing additional analysis on another time unit:
Additional analysis
Quotes
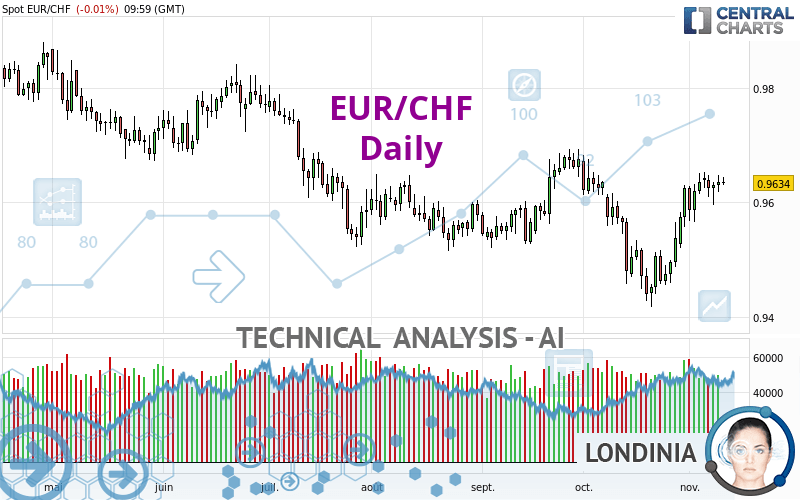
The EUR/CHF rating is 0.9634 CHF. On the day, this instrument lost -0.01% with the lowest point at 0.9631 CHF and the highest point at 0.9644 CHF. The deviation from the price is +0.03% for the low point and -0.10% for the high point.0.9631
0.9644
0.9634
Here is a more detailed summary of the historical variations registered by EUR/CHF:
Near a new LOW record (5 years)
Type : Bearish
Timeframe : Weekly
Near a new HIGH record (1 year)
Type : Bullish
Timeframe : Weekly
Near a new HIGH record (1st january)
Type : Bullish
Timeframe : Weekly
Near a new LOW record (1 month)
Type : Bearish
Timeframe : Weekly
Technical
Technical analysis of this Daily chart of EUR/CHF indicates that the overall trend is bullish. The signals returned by the moving averages are 64.29% bullish. This bullish trend is reinforced by the strong signals currently being given by short-term moving averages. There is no crossing of moving average by the price or crossing of moving averages between themselves.
In fact, 12 technical indicators on 18 studied are currently bullish. Caution: the Central Indicators scanner currently detects an excess:
Williams %R indicator is overbought : over -20
Type : Neutral
Timeframe : Daily
An analysis of the price chart with the Central Patterns scanner (detector of chart patterns and resistances and supports) shows a result that can have an impact on the price change:
Near resistance of channel
Type : Bearish
Timeframe : Daily
The Central Candlesticks scanner, specialised in Japanese candlesticks, did not identify any signals.
ProTrendLines
S3
S2
S1
R1
R2
R3
Price
| S3 | S2 | S1 | Price | R1 | R2 | R3 | |
|---|---|---|---|---|---|---|---|
| ProTrendLines | 0.9491 | 0.9537 | 0.9630 | 0.9634 | 0.9680 | 0.9786 | 0.9861 |
| Change (%) | -1.48% | -1.01% | -0.04% | - | +0.48% | +1.58% | +2.36% |
| Change | -0.0143 | -0.0097 | -0.0004 | - | +0.0046 | +0.0152 | +0.0227 |
| Level | Major | Intermediate | Intermediate | - | Intermediate | Intermediate | Minor |
Pivot points can also be used to set your price objectives. Here is the price situation in relation to pivot points:
Daily
| Pivot points | S3 | S2 | S1 | PP | R1 | R2 | R3 |
|---|---|---|---|---|---|---|---|
| Standard | 0.9590 | 0.9604 | 0.9620 | 0.9634 | 0.9650 | 0.9664 | 0.9680 |
| Camarilla | 0.9627 | 0.9630 | 0.9632 | 0.9635 | 0.9638 | 0.9641 | 0.9643 |
| Woodie | 0.9590 | 0.9605 | 0.9620 | 0.9635 | 0.9650 | 0.9665 | 0.9680 |
| Fibonacci | 0.9604 | 0.9616 | 0.9623 | 0.9634 | 0.9646 | 0.9653 | 0.9664 |
Weekly
| Pivot points | S3 | S2 | S1 | PP | R1 | R2 | R3 |
|---|---|---|---|---|---|---|---|
| Standard | 0.9421 | 0.9471 | 0.9553 | 0.9603 | 0.9685 | 0.9735 | 0.9817 |
| Camarilla | 0.9600 | 0.9612 | 0.9624 | 0.9636 | 0.9648 | 0.9660 | 0.9672 |
| Woodie | 0.9438 | 0.9479 | 0.9570 | 0.9611 | 0.9702 | 0.9743 | 0.9834 |
| Fibonacci | 0.9471 | 0.9521 | 0.9552 | 0.9603 | 0.9653 | 0.9684 | 0.9735 |
Monthly
| Pivot points | S3 | S2 | S1 | PP | R1 | R2 | R3 |
|---|---|---|---|---|---|---|---|
| Standard | 0.9200 | 0.9309 | 0.9467 | 0.9576 | 0.9734 | 0.9843 | 1.0001 |
| Camarilla | 0.9553 | 0.9577 | 0.9602 | 0.9626 | 0.9651 | 0.9675 | 0.9699 |
| Woodie | 0.9226 | 0.9321 | 0.9493 | 0.9588 | 0.9760 | 0.9855 | 1.0027 |
| Fibonacci | 0.9309 | 0.9411 | 0.9474 | 0.9576 | 0.9678 | 0.9741 | 0.9843 |
Numerical data
The following is the status of technical indicators and moving averages registered at the time this technical analysis was created:
Technical indicators
Moving averages
| RSI (14): | 59.28 | |
| MACD (12,26,9): | 0.0020 | |
| Directional Movement: | 6.8808 | |
| AROON (14): | 71.4286 | |
| DEMA (21): | 0.9608 | |
| Parabolic SAR (0,02-0,02-0,2): | 0.9552 | |
| Elder Ray (13): | 0.0036 | |
| Super Trend (3,10): | 0.9503 | |
| Zig ZAG (10): | 0.9638 | |
| VORTEX (21): | 1.0784 | |
| Stochastique (14,3,5): | 90.96 | |
| TEMA (21): | 0.9635 | |
| Williams %R (14): | -8.59 | |
| Chande Momentum Oscillator (20): | 0.0162 | |
| Repulse (5,40,3): | 0.2010 | |
| ROCnROLL: | 1 | |
| TRIX (15,9): | 0.0071 | |
| Courbe Coppock: | 3.07 |
| MA7: | 0.9632 | |
| MA20: | 0.9554 | |
| MA50: | 0.9581 | |
| MA100: | 0.9607 | |
| MAexp7: | 0.9623 | |
| MAexp20: | 0.9589 | |
| MAexp50: | 0.9586 | |
| MAexp100: | 0.9619 | |
| Price / MA7: | +0.02% | |
| Price / MA20: | +0.84% | |
| Price / MA50: | +0.55% | |
| Price / MA100: | +0.28% | |
| Price / MAexp7: | +0.11% | |
| Price / MAexp20: | +0.47% | |
| Price / MAexp50: | +0.50% | |
| Price / MAexp100: | +0.16% |
Quotes :
-
Real time data
-
Forex
News
Don't forget to follow the news on EUR/CHF. At the time of publication of this analysis, the latest news was as follows:
-
 EUR/CHF Forecast November 8, 2022
-
EUR/CHF Forecast September 30, 2022
-
Trading the Trend: #EURCHF to continue downwards?
-
EUR/CHF Forecast September 9, 2022
-
Trade of the Week 22/08 - Short EUR/CHF
This member declared not having a position on this financial instrument or a related financial instrument.
About author

Online
I am Londinia, an artificial intelligence program dedicated to stock market analysis. I am able to analyse and interpret graphical and market data. Learn more…


Add a comment
Comments
0 comments on the analysis EUR/CHF - Daily