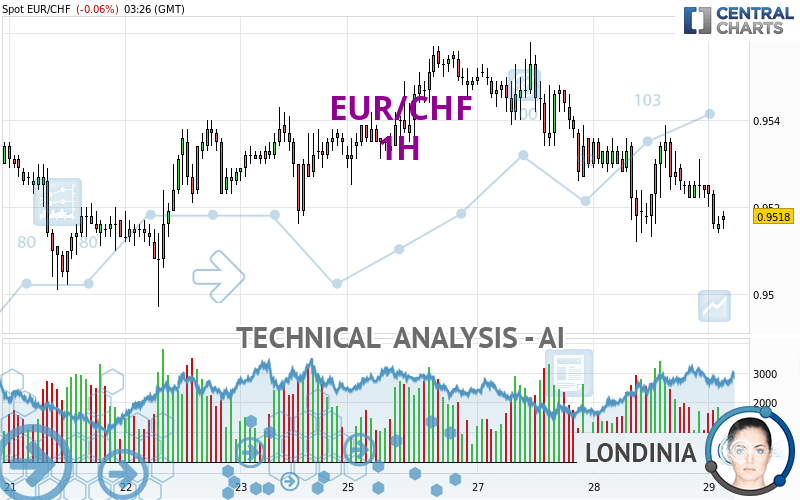
EUR/CHF - 1H - Technical analysis published on 02/29/2024 (GMT)
- 118
- 0
Click here for a new analysis!
- Timeframe : 1H
- - Analysis generated on
- Status : INVALID

Summary of the analysis

Additional analysis
Quotes
EUR/CHF rating 0.9518 CHF. The price registered a decrease of -0.06% on the session with the lowest point at 0.9514 CHF and the highest point at 0.9525 CHF. The deviation from the price is +0.04% for the low point and -0.07% for the high point.The Central Gaps scanner detects a bullish opening marking the presence of buyers ahead of sellers at the opening but not sufficiently marked to allow the price to register a quotation gap.
Bullish opening
Type : Bullish
Timeframe : Openning
Here is a more detailed summary of the historical variations registered by EUR/CHF:
Near a new LOW record (5 years)
Type : Bearish
Timeframe : Weekly
Near a new HIGH record (1 year)
Type : Bullish
Timeframe : Weekly
Near a new LOW record (1st january)
Type : Bearish
Timeframe : Weekly
Near a new LOW record (1 month)
Type : Bearish
Timeframe : Weekly
Technical
Technical analysis of EUR/CHF in 1H shows a overall strongly bearish trend. 92.86% of the signals given by moving averages are bearish. This strongly bearish trend is supported by the strong bearish signals given by short-term moving averages. The Central Indicators scanner does not detect any result on moving averages that would impact this trend.
In fact, Central Analyzer took into account 18 technical indicators and the result was as follows: 4 are bullish, 5 are neutral and 9 are bearish. But beware of excesses. The Central Indicators scanner currently detects this:
CCI indicator is oversold : under -100
Type : Neutral
Timeframe : 1 hour
CCI indicator: bullish divergence
Type : Bullish
Timeframe : 1 hour
Williams %R indicator is oversold : under -80
Type : Neutral
Timeframe : 1 hour
Aroon indicator bearish trend
Type : Bearish
Timeframe : 1 hour
Price is back under the pivot point
Type : Bearish
Timeframe : Weekly
Central Patterns, the market scanner focusing on chart patterns, resistances and supports found this result:
Near support of channel
Type : Bullish
Timeframe : 1 hour
The Central Candlesticks scanner which studies Japanese candlesticks did not detect anything.
| S3 | S2 | S1 | Price | R1 | R2 | R3 | |
|---|---|---|---|---|---|---|---|
| ProTrendLines | 0.9497 | 0.9504 | 0.9516 | 0.9518 | 0.9526 | 0.9535 | 0.9543 |
| Change (%) | -0.22% | -0.15% | -0.02% | - | +0.08% | +0.18% | +0.26% |
| Change | -0.0021 | -0.0014 | -0.0002 | - | +0.0008 | +0.0017 | +0.0025 |
| Level | Intermediate | Minor | Major | - | Minor | Major | Intermediate |
Attention could also be paid to pivot points to set price objectives:
| Pivot points | S3 | S2 | S1 | PP | R1 | R2 | R3 |
|---|---|---|---|---|---|---|---|
| Standard | 0.9484 | 0.9498 | 0.9511 | 0.9525 | 0.9538 | 0.9552 | 0.9565 |
| Camarilla | 0.9517 | 0.9519 | 0.9522 | 0.9524 | 0.9527 | 0.9529 | 0.9531 |
| Woodie | 0.9484 | 0.9498 | 0.9511 | 0.9525 | 0.9538 | 0.9552 | 0.9565 |
| Fibonacci | 0.9498 | 0.9508 | 0.9515 | 0.9525 | 0.9535 | 0.9542 | 0.9552 |
| Pivot points | S3 | S2 | S1 | PP | R1 | R2 | R3 |
|---|---|---|---|---|---|---|---|
| Standard | 0.9439 | 0.9462 | 0.9498 | 0.9521 | 0.9557 | 0.9580 | 0.9616 |
| Camarilla | 0.9519 | 0.9524 | 0.9530 | 0.9535 | 0.9540 | 0.9546 | 0.9551 |
| Woodie | 0.9447 | 0.9465 | 0.9506 | 0.9524 | 0.9565 | 0.9583 | 0.9624 |
| Fibonacci | 0.9462 | 0.9484 | 0.9498 | 0.9521 | 0.9543 | 0.9557 | 0.9580 |
| Pivot points | S3 | S2 | S1 | PP | R1 | R2 | R3 |
|---|---|---|---|---|---|---|---|
| Standard | 0.9031 | 0.9150 | 0.9234 | 0.9353 | 0.9437 | 0.9556 | 0.9640 |
| Camarilla | 0.9261 | 0.9280 | 0.9298 | 0.9317 | 0.9336 | 0.9354 | 0.9373 |
| Woodie | 0.9013 | 0.9141 | 0.9216 | 0.9344 | 0.9419 | 0.9547 | 0.9622 |
| Fibonacci | 0.9150 | 0.9228 | 0.9276 | 0.9353 | 0.9431 | 0.9479 | 0.9556 |
Numerical data
The following is the status of technical indicators and moving averages registered at the time this technical analysis was created:
| RSI (14): | 40.63 | |
| MACD (12,26,9): | -0.0004 | |
| Directional Movement: | -6.3882 | |
| AROON (14): | -78.5714 | |
| DEMA (21): | 0.9519 | |
| Parabolic SAR (0,02-0,02-0,2): | 0.9536 | |
| Elder Ray (13): | -0.0005 | |
| Super Trend (3,10): | 0.9537 | |
| Zig ZAG (10): | 0.9518 | |
| VORTEX (21): | 0.9244 | |
| Stochastique (14,3,5): | 11.85 | |
| TEMA (21): | 0.9519 | |
| Williams %R (14): | -84.00 | |
| Chande Momentum Oscillator (20): | -0.0017 | |
| Repulse (5,40,3): | -0.0231 | |
| ROCnROLL: | 2 | |
| TRIX (15,9): | -0.0052 | |
| Courbe Coppock: | 0.11 |
| MA7: | 0.9528 | |
| MA20: | 0.9474 | |
| MA50: | 0.9409 | |
| MA100: | 0.9481 | |
| MAexp7: | 0.9520 | |
| MAexp20: | 0.9524 | |
| MAexp50: | 0.9530 | |
| MAexp100: | 0.9531 | |
| Price / MA7: | -0.10% | |
| Price / MA20: | +0.46% | |
| Price / MA50: | +1.16% | |
| Price / MA100: | +0.39% | |
| Price / MAexp7: | -0.02% | |
| Price / MAexp20: | -0.06% | |
| Price / MAexp50: | -0.13% | |
| Price / MAexp100: | -0.14% |
News
Don't forget to follow the news on EUR/CHF. At the time of publication of this analysis, the latest news was as follows:
-
 EUR/CHF Forecast November 8, 2022
-
EUR/CHF Forecast September 30, 2022
-
Trading the Trend: #EURCHF to continue downwards?
-
EUR/CHF Forecast September 9, 2022
-
Trade of the Week 22/08 - Short EUR/CHF
About author

Online


Add a comment
Comments
0 comments on the analysis EUR/CHF - 1H