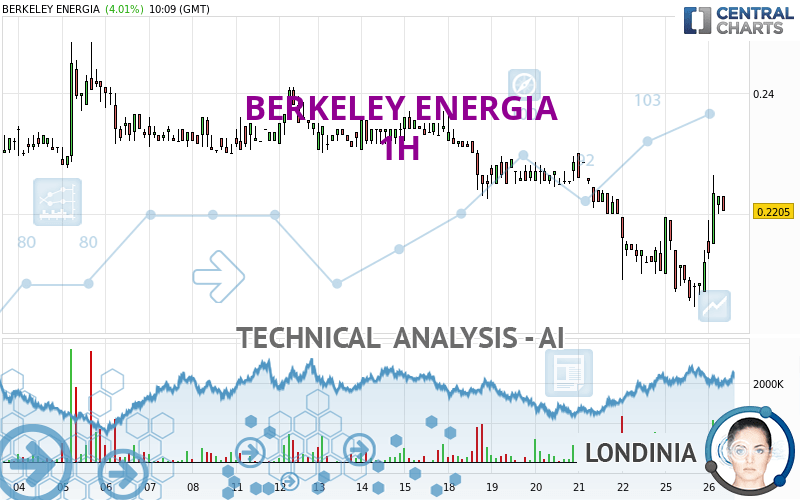
BERKELEY ENERGIA - 1H - Technical analysis published on 09/26/2023 (GMT)
- 99
- 0
Click here for a new analysis!
- Timeframe : 1H
- - Analysis generated on
- Status : INVALID
Summary of the analysis

Additional analysis
Quotes
BERKELEY ENERGIA rating 0.2230 EUR. The price has increased by +5.19% since the last closing with the lowest point at 0.2125 EUR and the highest point at 0.2265 EUR. The deviation from the price is +4.94% for the low point and -1.55% for the high point.The Central Gaps scanner detects a bullish opening. A small advantage for buyers in the very short term.
Bullish opening
Type : Bullish
Timeframe : Openning
A study of price movements over other periods shows the following variations:
Near a new LOW record (1 month)
Type : Bearish
Timeframe : Weekly
Technical
A technical analysis in 1H of this BERKELEY ENERGIA chart shows a slightly bearish trend. Only 57.14% of the signals given by moving averages are bearish. This slightly bearish trend could quickly be reversed due to the strong bullish signals currently being given by short-term moving averages. The Central Indicators scanner detects bullish signals on moving averages that could impact this trend:
Bullish trend reversal : Moving Average 20
Type : Bullish
Timeframe : 1 hour
Bullish trend reversal : adaptative moving average 50
Type : Bullish
Timeframe : 1 hour
In fact, 13 technical indicators on 18 studied are currently positioned bullish. But beware of excesses. The Central Indicators scanner currently detects this:
CCI indicator is overbought : over 100
Type : Neutral
Timeframe : 1 hour
Previous candle closed over Bollinger bands
Type : Neutral
Timeframe : 1 hour
Williams %R indicator is overbought : over -20
Type : Neutral
Timeframe : 1 hour
Pivot points : price is over resistance 1
Type : Neutral
Timeframe : 1 hour
Price is back over the pivot point
Type : Bullish
Timeframe : Weekly
Central Patterns, the scanner specializing in chart patterns, did not identify any signals.
For a small setback in the very short term, the Central Candlesticks scanner currently notes the presence of this bearish pattern in Japanese candlesticks:
Bearish harami cross
Type : Bearish
Timeframe : 1 hour
| S3 | S2 | S1 | Price | R1 | R2 | R3 | |
|---|---|---|---|---|---|---|---|
| ProTrendLines | 0.1616 | 0.2102 | 0.2195 | 0.2230 | 0.2301 | 0.2339 | 0.2485 |
| Change (%) | -27.53% | -5.74% | -1.57% | - | +3.18% | +4.89% | +11.43% |
| Change | -0.0614 | -0.0128 | -0.0035 | - | +0.0071 | +0.0109 | +0.0255 |
| Level | Intermediate | Major | Minor | - | Major | Major | Intermediate |
Attention could also be paid to pivot points to set price objectives:
| Pivot points | S3 | S2 | S1 | PP | R1 | R2 | R3 |
|---|---|---|---|---|---|---|---|
| Standard | 0.1895 | 0.1970 | 0.2045 | 0.2120 | 0.2195 | 0.2270 | 0.2345 |
| Camarilla | 0.2079 | 0.2093 | 0.2106 | 0.2120 | 0.2134 | 0.2148 | 0.2161 |
| Woodie | 0.1895 | 0.1970 | 0.2045 | 0.2120 | 0.2195 | 0.2270 | 0.2345 |
| Fibonacci | 0.1970 | 0.2027 | 0.2063 | 0.2120 | 0.2177 | 0.2213 | 0.2270 |
| Pivot points | S3 | S2 | S1 | PP | R1 | R2 | R3 |
|---|---|---|---|---|---|---|---|
| Standard | 0.1727 | 0.1908 | 0.2007 | 0.2188 | 0.2287 | 0.2468 | 0.2567 |
| Camarilla | 0.2028 | 0.2054 | 0.2079 | 0.2105 | 0.2131 | 0.2156 | 0.2182 |
| Woodie | 0.1685 | 0.1888 | 0.1965 | 0.2168 | 0.2245 | 0.2448 | 0.2525 |
| Fibonacci | 0.1908 | 0.2015 | 0.2081 | 0.2188 | 0.2295 | 0.2361 | 0.2468 |
| Pivot points | S3 | S2 | S1 | PP | R1 | R2 | R3 |
|---|---|---|---|---|---|---|---|
| Standard | 0.1510 | 0.1880 | 0.2090 | 0.2460 | 0.2670 | 0.3040 | 0.3250 |
| Camarilla | 0.2141 | 0.2194 | 0.2247 | 0.2300 | 0.2353 | 0.2406 | 0.2460 |
| Woodie | 0.1430 | 0.1840 | 0.2010 | 0.2420 | 0.2590 | 0.3000 | 0.3170 |
| Fibonacci | 0.1880 | 0.2102 | 0.2238 | 0.2460 | 0.2682 | 0.2818 | 0.3040 |
Numerical data
The following are the details of the technical indicators and moving averages that were collected to generate this technical analysis:
| RSI (14): | 59.04 | |
| MACD (12,26,9): | -0.0011 | |
| Directional Movement: | 9.1306 | |
| AROON (14): | 28.5714 | |
| DEMA (21): | 0.2128 | |
| Parabolic SAR (0,02-0,02-0,2): | 0.2065 | |
| Elder Ray (13): | 0.0067 | |
| Super Trend (3,10): | 0.2057 | |
| Zig ZAG (10): | 0.2230 | |
| VORTEX (21): | 0.9431 | |
| Stochastique (14,3,5): | 76.82 | |
| TEMA (21): | 0.2146 | |
| Williams %R (14): | -15.91 | |
| Chande Momentum Oscillator (20): | 0.0125 | |
| Repulse (5,40,3): | 3.9722 | |
| ROCnROLL: | 1 | |
| TRIX (15,9): | -0.2001 | |
| Courbe Coppock: | 0.61 |
| MA7: | 0.2209 | |
| MA20: | 0.2288 | |
| MA50: | 0.2534 | |
| MA100: | 0.2886 | |
| MAexp7: | 0.2163 | |
| MAexp20: | 0.2151 | |
| MAexp50: | 0.2195 | |
| MAexp100: | 0.2245 | |
| Price / MA7: | +0.95% | |
| Price / MA20: | -2.53% | |
| Price / MA50: | -12.00% | |
| Price / MA100: | -22.73% | |
| Price / MAexp7: | +3.10% | |
| Price / MAexp20: | +3.67% | |
| Price / MAexp50: | +1.59% | |
| Price / MAexp100: | -0.67% |
About author
Online


Add a comment
Comments
0 comments on the analysis BERKELEY ENERGIA - 1H