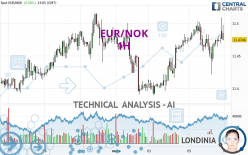
EUR/NOK - 1H - Technical analysis published on 03/05/2024 (GMT)
- 127
- 0
Click here for a new analysis!
- Timeframe : 1H
- - Analysis generated on
- Status : TARGET REACHED

Summary of the analysis

Additional analysis
Quotes
The EUR/NOK price is 11.4746 NOK. On the day, this instrument gained +0.00% and was between 11.4212 NOK and 11.5090 NOK. This implies that the price is at +0.47% from its lowest and at -0.30% from its highest.A bullish opening was detected by the Central Gaps scanner. Buyers are trying to impose a bullish momentum in the very short term.
Bullish opening
Type : Bullish
Timeframe : Openning
So that you have an overall view of the price change, here is a table showing the variations over several periods:
Near a new LOW record (1 year)
Type : Bearish
Timeframe : Weekly
Near a new LOW record (1st january)
Type : Bearish
Timeframe : Weekly
Near a new LOW record (1 month)
Type : Bearish
Timeframe : Weekly
Technical
Technical analysis of EUR/NOK in 1H shows a strongly overall bullish trend. 89.29% of the signals given by moving averages are bullish. The overall trend is supported by the strong bullish signals from short-term moving averages. An assessment of moving averages reveals several bullish signals that could impact this trend:
Bullish trend reversal : Moving Average 20
Type : Bullish
Timeframe : 1 hour
Bullish trend reversal : Moving Average 100
Type : Bullish
Timeframe : 1 hour
Bullish price crossover with adaptative moving average 20
Type : Bullish
Timeframe : 1 hour
An assessment of technical indicators shows a moderate bullish signal.
Caution: the Central Indicators scanner currently detects an excess:
CCI indicator is overbought : over 100
Type : Neutral
Timeframe : 1 hour
Williams %R indicator is overbought : over -20
Type : Neutral
Timeframe : 1 hour
Pivot points : price is over resistance 1
Type : Neutral
Timeframe : Weekly
MACD crosses UP its Moving Average
Type : Bullish
Timeframe : 1 hour
Aroon indicator bullish trend
Type : Bullish
Timeframe : 1 hour
An analysis of the price chart with the Central Patterns scanner (detector of chart patterns and resistances and supports) shows several results that can have an impact on the price change:
Near horizontal resistance
Type : Bearish
Timeframe : 1 hour
Resistance of channel is broken
Type : Bullish
Timeframe : 1 hour
The Central Candlesticks scanner, specialised in Japanese candlesticks, did not identify any signals.
| S3 | S2 | S1 | Price | R1 | R2 | R3 | |
|---|---|---|---|---|---|---|---|
| ProTrendLines | 11.3588 | 11.3915 | 11.4669 | 11.4746 | 11.4880 | 11.5155 | 11.5991 |
| Change (%) | -1.01% | -0.72% | -0.07% | - | +0.12% | +0.36% | +1.09% |
| Change | -0.1158 | -0.0831 | -0.0077 | - | +0.0134 | +0.0409 | +0.1245 |
| Level | Minor | Major | Intermediate | - | Intermediate | Intermediate | Intermediate |
Attention could also be paid to pivot points to set price objectives:
| Pivot points | S3 | S2 | S1 | PP | R1 | R2 | R3 |
|---|---|---|---|---|---|---|---|
| Standard | 11.3211 | 11.3553 | 11.4149 | 11.4491 | 11.5087 | 11.5429 | 11.6025 |
| Camarilla | 11.4486 | 11.4572 | 11.4658 | 11.4744 | 11.4830 | 11.4916 | 11.5002 |
| Woodie | 11.3337 | 11.3617 | 11.4275 | 11.4555 | 11.5213 | 11.5493 | 11.6151 |
| Fibonacci | 11.3553 | 11.3912 | 11.4133 | 11.4491 | 11.4850 | 11.5071 | 11.5429 |
| Pivot points | S3 | S2 | S1 | PP | R1 | R2 | R3 |
|---|---|---|---|---|---|---|---|
| Standard | 11.2078 | 11.2920 | 11.3471 | 11.4313 | 11.4864 | 11.5706 | 11.6257 |
| Camarilla | 11.3639 | 11.3767 | 11.3894 | 11.4022 | 11.4150 | 11.4277 | 11.4405 |
| Woodie | 11.1933 | 11.2847 | 11.3326 | 11.4240 | 11.4719 | 11.5633 | 11.6112 |
| Fibonacci | 11.2920 | 11.3452 | 11.3781 | 11.4313 | 11.4845 | 11.5174 | 11.5706 |
| Pivot points | S3 | S2 | S1 | PP | R1 | R2 | R3 |
|---|---|---|---|---|---|---|---|
| Standard | 11.1170 | 11.2039 | 11.3417 | 11.4286 | 11.5664 | 11.6533 | 11.7911 |
| Camarilla | 11.4177 | 11.4383 | 11.4589 | 11.4795 | 11.5001 | 11.5207 | 11.5413 |
| Woodie | 11.1425 | 11.2166 | 11.3672 | 11.4413 | 11.5919 | 11.6660 | 11.8166 |
| Fibonacci | 11.2039 | 11.2897 | 11.3428 | 11.4286 | 11.5144 | 11.5675 | 11.6533 |
Numerical data
The following are the details of the technical indicators and moving averages that were collected to generate this technical analysis:
| RSI (14): | 63.89 | |
| MACD (12,26,9): | 0.0050 | |
| Directional Movement: | 8.6520 | |
| AROON (14): | 50.0000 | |
| DEMA (21): | 11.4780 | |
| Parabolic SAR (0,02-0,02-0,2): | 11.4309 | |
| Elder Ray (13): | 0.0193 | |
| Super Trend (3,10): | 11.4992 | |
| Zig ZAG (10): | 11.4960 | |
| VORTEX (21): | 1.0044 | |
| Stochastique (14,3,5): | 71.57 | |
| TEMA (21): | 11.4774 | |
| Williams %R (14): | -11.28 | |
| Chande Momentum Oscillator (20): | 0.0332 | |
| Repulse (5,40,3): | 0.2122 | |
| ROCnROLL: | 1 | |
| TRIX (15,9): | 0.0062 | |
| Courbe Coppock: | 0.11 |
| MA7: | 11.4521 | |
| MA20: | 11.3947 | |
| MA50: | 11.3638 | |
| MA100: | 11.5389 | |
| MAexp7: | 11.4774 | |
| MAexp20: | 11.4710 | |
| MAexp50: | 11.4612 | |
| MAexp100: | 11.4510 | |
| Price / MA7: | +0.20% | |
| Price / MA20: | +0.70% | |
| Price / MA50: | +0.98% | |
| Price / MA100: | -0.56% | |
| Price / MAexp7: | -0.02% | |
| Price / MAexp20: | +0.03% | |
| Price / MAexp50: | +0.12% | |
| Price / MAexp100: | +0.21% |
About author
Online


Add a comment
Comments
0 comments on the analysis EUR/NOK - 1H