EUR/USD - Dips Below 1.0600 - Hit Fresh 1-Month Low - 04/11/2017 (GMT)
- Who voted?
- 302
- 0
- Timeframe : Daily
EUR/USD Chart
Are you looking for opportunities in indices and forex?
DISCOVER LONDINIA OPPORTUNITIES...
DISCOVER LONDINIA OPPORTUNITIES...
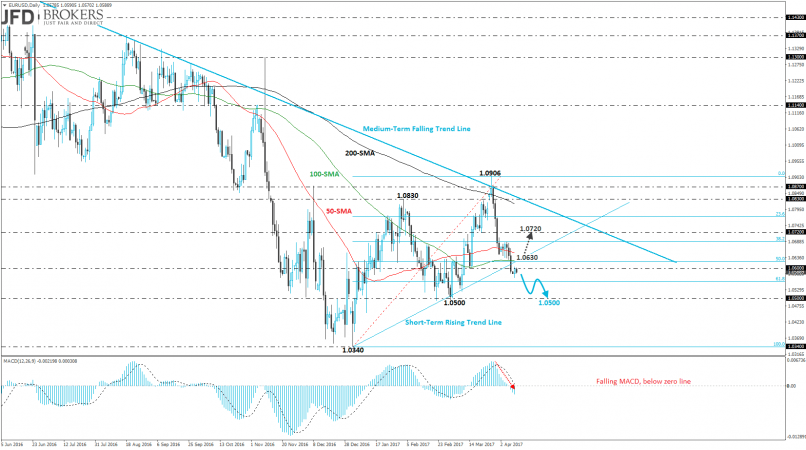
The single currency affected by U.S. dollar on Friday as it recorded a weaker NFP report and the U.S. is close to full employment. The EUR/USD pair slipped for the second red consecutive week and plummeted almost 2%. The rebound on the medium-term descending trend line drove the price sharply lower at 1.0570, posting a fresh one-month low.
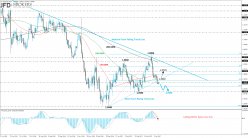
The technical structure suggests further downside movement as the price broke the short-term rising trend line to the downside and is approaching the 1.0500 significant psychological level. Though, the pair needs to go through the 61.8% Fibonacci retracement level near 1.0560, with low at 1.0340 and high at 1.0906. Otherwise, a run above 50.0% fibo level at 1.0620, will expose the common currency pair towards 1.0720. On the 4-hour chart, the 50-SMA is moving downwards and is in progress to create a bearish crossover with the 200-SMA, indicating a strong negative momentum. On the daily chart, the MACD oscillator fell below the neutral level and is moving lower.
The technical structure suggests further downside movement as the price broke the short-term rising trend line to the downside and is approaching the 1.0500 significant psychological level. Though, the pair needs to go through the 61.8% Fibonacci retracement level near 1.0560, with low at 1.0340 and high at 1.0906. Otherwise, a run above 50.0% fibo level at 1.0620, will expose the common currency pair towards 1.0720. On the 4-hour chart, the 50-SMA is moving downwards and is in progress to create a bearish crossover with the 200-SMA, indicating a strong negative momentum. On the daily chart, the MACD oscillator fell below the neutral level and is moving lower.
This member did not declare if he had a position on this financial instrument or a related financial instrument.
About author

Offline


Add a comment
Comments
0 comments on the analysis EUR/USD - Daily