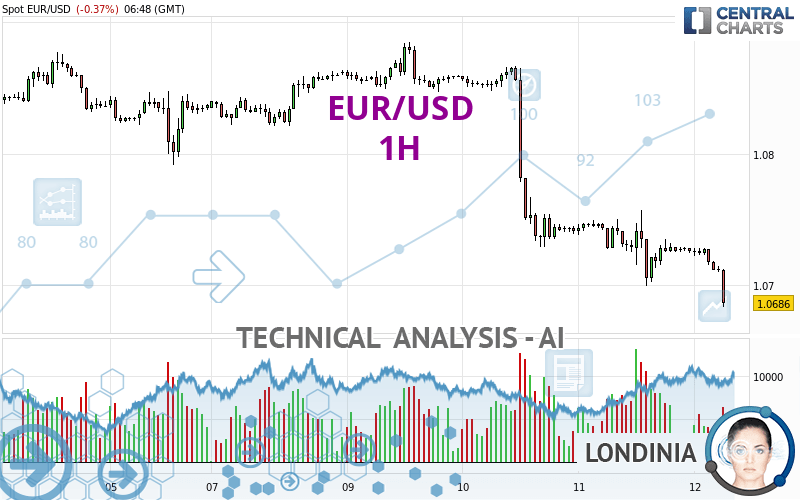
EUR/USD - 1H - Technical analysis published on 04/12/2024 (GMT)
- 84
- 0
Click here for a new analysis!
- Timeframe : 1H
- - Analysis generated on
- Status : TARGET REACHED

Summary of the analysis

Additional analysis
Quotes
The EUR/USD rating is 1.0686 USD. The price is lower by -0.37% since the last closing with the lowest point at 1.0683 USD and the highest point at 1.0728 USD. The deviation from the price is +0.03% for the low point and -0.39% for the high point.Here is a more detailed summary of the historical variations registered by EUR/USD:
Near a new LOW record (1 year)
Type : Bearish
Timeframe : Weekly
Near a new HIGH record (1st january)
Type : Bullish
Timeframe : Weekly
New LOW record (1st january)
Type : Bearish
Timeframe : Weekly
Near a new HIGH record (1 month)
Type : Bullish
Timeframe : Weekly
New LOW record (1 month)
Type : Bearish
Timeframe : Weekly
Technical
Technical analysis of this 1H chart of EUR/USD indicates that the overall trend is strongly bearish. 92.86% of the signals given by moving averages are bearish. The overall trend is supported by the strong bearish signals from short-term moving averages. There is no crossing of moving average by the price or crossing of moving averages between themselves.
In fact, according to the parameters integrated into the Central Analyzer system, 12 technical indicators out of 18 analysed are currently bearish. Caution: the Central Indicators scanner currently detects an excess:
RSI indicator is oversold : under 30
Type : Neutral
Timeframe : 1 hour
CCI indicator is oversold : under -100
Type : Neutral
Timeframe : 1 hour
Williams %R indicator is oversold : under -80
Type : Neutral
Timeframe : 1 hour
Pivot points : price is under support 1
Type : Neutral
Timeframe : 1 hour
Pivot points : price is under support 1
Type : Neutral
Timeframe : Weekly
MACD crosses DOWN its Moving Average
Type : Bearish
Timeframe : 1 hour
Aroon indicator bearish trend
Type : Bearish
Timeframe : 1 hour
The Central Patterns scanner, which studies chart patterns, resistances and supports, has identified this signal:
Near support of channel
Type : Bullish
Timeframe : 1 hour
The Central Candlesticks scanner which studies Japanese candlesticks did not detect anything.
| S3 | S2 | S1 | Price | R1 | R2 | R3 | |
|---|---|---|---|---|---|---|---|
| ProTrendLines | 1.0469 | 1.0564 | 1.0638 | 1.0686 | 1.0708 | 1.0724 | 1.0757 |
| Change (%) | -2.03% | -1.14% | -0.45% | - | +0.21% | +0.36% | +0.66% |
| Change | -0.0217 | -0.0122 | -0.0048 | - | +0.0022 | +0.0038 | +0.0071 |
| Level | Intermediate | Minor | Major | - | Major | Minor | Minor |
Attention could also be paid to pivot points to set price objectives:
| Pivot points | S3 | S2 | S1 | PP | R1 | R2 | R3 |
|---|---|---|---|---|---|---|---|
| Standard | 1.0640 | 1.0669 | 1.0698 | 1.0727 | 1.0756 | 1.0785 | 1.0814 |
| Camarilla | 1.0710 | 1.0715 | 1.0721 | 1.0726 | 1.0731 | 1.0737 | 1.0742 |
| Woodie | 1.0639 | 1.0669 | 1.0697 | 1.0727 | 1.0755 | 1.0785 | 1.0813 |
| Fibonacci | 1.0669 | 1.0692 | 1.0705 | 1.0727 | 1.0750 | 1.0763 | 1.0785 |
| Pivot points | S3 | S2 | S1 | PP | R1 | R2 | R3 |
|---|---|---|---|---|---|---|---|
| Standard | 1.0595 | 1.0660 | 1.0748 | 1.0813 | 1.0901 | 1.0966 | 1.1054 |
| Camarilla | 1.0795 | 1.0809 | 1.0823 | 1.0837 | 1.0851 | 1.0865 | 1.0879 |
| Woodie | 1.0608 | 1.0666 | 1.0761 | 1.0819 | 1.0914 | 1.0972 | 1.1067 |
| Fibonacci | 1.0660 | 1.0718 | 1.0754 | 1.0813 | 1.0871 | 1.0907 | 1.0966 |
| Pivot points | S3 | S2 | S1 | PP | R1 | R2 | R3 |
|---|---|---|---|---|---|---|---|
| Standard | 1.0498 | 1.0633 | 1.0712 | 1.0847 | 1.0926 | 1.1061 | 1.1140 |
| Camarilla | 1.0733 | 1.0753 | 1.0772 | 1.0792 | 1.0812 | 1.0831 | 1.0851 |
| Woodie | 1.0471 | 1.0619 | 1.0685 | 1.0833 | 1.0899 | 1.1047 | 1.1113 |
| Fibonacci | 1.0633 | 1.0714 | 1.0765 | 1.0847 | 1.0928 | 1.0979 | 1.1061 |
Numerical data
The following is the status of the technical indicators and moving averages at the time of publication of this technical analysis:
| RSI (14): | 31.03 | |
| MACD (12,26,9): | -0.0011 | |
| Directional Movement: | -20.0509 | |
| AROON (14): | -85.7143 | |
| DEMA (21): | 1.0709 | |
| Parabolic SAR (0,02-0,02-0,2): | 1.0742 | |
| Elder Ray (13): | -0.0012 | |
| Super Trend (3,10): | 1.0733 | |
| Zig ZAG (10): | 1.0699 | |
| VORTEX (21): | 0.8730 | |
| Stochastique (14,3,5): | 12.57 | |
| TEMA (21): | 1.0711 | |
| Williams %R (14): | -93.33 | |
| Chande Momentum Oscillator (20): | -0.0033 | |
| Repulse (5,40,3): | -0.2730 | |
| ROCnROLL: | 2 | |
| TRIX (15,9): | -0.0141 | |
| Courbe Coppock: | 0.21 |
| MA7: | 1.0792 | |
| MA20: | 1.0816 | |
| MA50: | 1.0824 | |
| MA100: | 1.0867 | |
| MAexp7: | 1.0710 | |
| MAexp20: | 1.0724 | |
| MAexp50: | 1.0751 | |
| MAexp100: | 1.0778 | |
| Price / MA7: | -0.98% | |
| Price / MA20: | -1.20% | |
| Price / MA50: | -1.27% | |
| Price / MA100: | -1.67% | |
| Price / MAexp7: | -0.22% | |
| Price / MAexp20: | -0.35% | |
| Price / MAexp50: | -0.60% | |
| Price / MAexp100: | -0.85% |
News
Don't forget to follow the news on EUR/USD. At the time of publication of this analysis, the latest news was as follows:
-
 EUR/USD Daily Forecast and Technical Analysis for April 11, 2024, by Chris Lewis for FX Empire
-
EUR/USD Forecast and Technical Analysis, April 10, 2024, by Chris Lewis #fxempire #trading #eurusd
-
EUR/USD Daily Forecast and Technical Analysis for April 10, 2024, by Chris Lewis for FX Empire
-
EUR/USD Daily Forecast and Technical Analysis for April 09, 2024, by Chris Lewis for FX Empire
-
EUR/USD Daily Forecast and Technical Analysis for April 08, 2024, by Chris Lewis for FX Empire
About author

Online


Add a comment
Comments
0 comments on the analysis EUR/USD - 1H