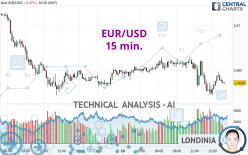
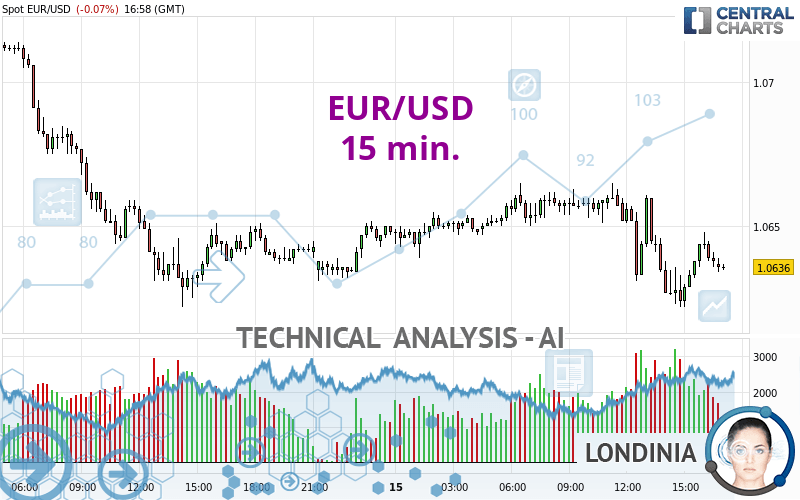
EUR/USD - 15 min. - Technical analysis published on 04/15/2024 (GMT)
- 79
- 0
I am pleased to note that the threshold for invalidation has been maintained for 20 Candlesticks.
Click here for a new analysis!
Click here for a new analysis!
- Timeframe : 15 min.
- - Analysis generated on
- Status : LEVEL MAINTAINED
Summary of the analysis
Trends
Short term:
Strongly bearish
Underlying:
Strongly bearish
Technical indicators
22%
33%
44%
My opinion
Bearish under 1.0664 USD
My targets
1.0601 USD (-0.0035)
1.0558 USD (-0.0078)
My analysis
The bearish trend is currently very strong for EUR/USD. As long as the price remains below the resistance at 1.0664 USD, you could try to take advantage of the bearish rally. The first bearish objective is located at 1.0601 USD. The bearish momentum would be revived by a break in this support. Sellers would then use the next support located at 1.0558 USD as an objective. Crossing it would then enable sellers to target 1.0495 USD. Be careful, given the powerful bearish rally underway, excesses could lead to a short-term rebound. If this is the case, remember that trading against the trend may be riskier. It would seem more appropriate to wait for a signal indicating reversal of the trend.
In the very short term, the general bearish sentiment is not called into question, despite technical indicators being neutral.
Force
0
10
6.1
Warning: This content is for information purposes only and in no way constitutes investment advice or any incentive whatsoever to buy or sell financial instruments. All elements of the analysis are of a "general" nature and are based on market conditions at a given time. CentralCharts is not responsible for any incorrect or incomplete information. Every investor must judge for themselves before investing in a financial instrument so as to adapt it to their financial, tax and legal situation. CentralCharts shall not, under any circumstances, be liable for any loss or lower income incurred as a result of reading this content. Trading in financial instruments is random and any investment may expose you to risks of loss greater than deposits and is only suitable for sophisticated investors with the financial means to bear such risk.

This analysis was given by stebetrade. Take part yourself by sharing additional analysis on another time unit:
Additional analysis
Quotes
The EUR/USD rating is 1.0636 USD. The price registered a decrease of -0.07% on the session with the lowest point at 1.0622 USD and the highest point at 1.0665 USD. The deviation from the price is +0.13% for the low point and -0.27% for the high point.1.0622
1.0665
1.0636
The Central Gaps scanner detects a bearish opening marking the presence of sellers ahead of buyers at the opening but not sufficiently marked to allow the price to register a quotation gap.
Bearish opening
Type : Bearish
Timeframe : Openning
So that you have an overall view of the price change, here is a table showing the variations over several periods:
Near a new LOW record (1 year)
Type : Bearish
Timeframe : Weekly
Near a new HIGH record (1st january)
Type : Bullish
Timeframe : Weekly
New LOW record (1st january)
Type : Bearish
Timeframe : Weekly
Near a new HIGH record (1 month)
Type : Bullish
Timeframe : Weekly
New LOW record (1 month)
Type : Bearish
Timeframe : Weekly
Technical
Technical analysis of EUR/USD in 15 min. shows a overall strongly bearish trend. 89.29% of the signals given by moving averages are bearish. The overall trend is supported by the strong bearish signals from short-term moving averages. The Central Indicators market scanner is currently detecting a bearish signal that could impact this trend:
Bearish trend reversal : adaptative moving average 20
Type : Bearish
Timeframe : 15 minutes
On the 18 technical indicators analysed, 4 are bullish, 8 are neutral and 6 are bearish. The Central Indicators scanner found no further results concerning independent technical indicators.
Central Patterns, the market scanner focusing on chart patterns, resistances and supports found this result:
Near resistance of channel
Type : Bearish
Timeframe : 15 minutes
The Central Candlesticks scanner which studies Japanese candlesticks did not detect anything.
ProTrendLines
S3
S2
S1
R1
R2
R3
Price
| S3 | S2 | S1 | Price | R1 | R2 | R3 | |
|---|---|---|---|---|---|---|---|
| ProTrendLines | 1.0129 | 1.0469 | 1.0564 | 1.0636 | 1.0638 | 1.0708 | 1.0757 |
| Change (%) | -4.77% | -1.57% | -0.68% | - | +0.02% | +0.68% | +1.14% |
| Change | -0.0507 | -0.0167 | -0.0072 | - | +0.0002 | +0.0072 | +0.0121 |
| Level | Minor | Intermediate | Minor | - | Major | Major | Minor |
Pivot points can also be used to set your price objectives. Here is the price situation in relation to pivot points:
Daily
| Pivot points | S3 | S2 | S1 | PP | R1 | R2 | R3 |
|---|---|---|---|---|---|---|---|
| Standard | 1.0495 | 1.0558 | 1.0601 | 1.0664 | 1.0707 | 1.0770 | 1.0813 |
| Camarilla | 1.0614 | 1.0624 | 1.0633 | 1.0643 | 1.0653 | 1.0662 | 1.0672 |
| Woodie | 1.0484 | 1.0553 | 1.0590 | 1.0659 | 1.0696 | 1.0765 | 1.0802 |
| Fibonacci | 1.0558 | 1.0599 | 1.0624 | 1.0664 | 1.0705 | 1.0730 | 1.0770 |
Weekly
| Pivot points | S3 | S2 | S1 | PP | R1 | R2 | R3 |
|---|---|---|---|---|---|---|---|
| Standard | 1.0285 | 1.0454 | 1.0548 | 1.0717 | 1.0811 | 1.0980 | 1.1074 |
| Camarilla | 1.0571 | 1.0595 | 1.0619 | 1.0643 | 1.0667 | 1.0691 | 1.0715 |
| Woodie | 1.0249 | 1.0435 | 1.0512 | 1.0698 | 1.0775 | 1.0961 | 1.1038 |
| Fibonacci | 1.0454 | 1.0554 | 1.0616 | 1.0717 | 1.0817 | 1.0879 | 1.0980 |
Monthly
| Pivot points | S3 | S2 | S1 | PP | R1 | R2 | R3 |
|---|---|---|---|---|---|---|---|
| Standard | 1.0498 | 1.0633 | 1.0712 | 1.0847 | 1.0926 | 1.1061 | 1.1140 |
| Camarilla | 1.0733 | 1.0753 | 1.0772 | 1.0792 | 1.0812 | 1.0831 | 1.0851 |
| Woodie | 1.0471 | 1.0619 | 1.0685 | 1.0833 | 1.0899 | 1.1047 | 1.1113 |
| Fibonacci | 1.0633 | 1.0714 | 1.0765 | 1.0847 | 1.0928 | 1.0979 | 1.1061 |
Numerical data
The following is the status of the technical indicators and moving averages at the time of publication of this technical analysis:
Technical indicators
Moving averages
| RSI (14): | 43.89 | |
| MACD (12,26,9): | -0.0004 | |
| Directional Movement: | -6.0319 | |
| AROON (14): | -50.0000 | |
| DEMA (21): | 1.0635 | |
| Parabolic SAR (0,02-0,02-0,2): | 1.0624 | |
| Elder Ray (13): | -0.0002 | |
| Super Trend (3,10): | 1.0653 | |
| Zig ZAG (10): | 1.0638 | |
| VORTEX (21): | 0.8730 | |
| Stochastique (14,3,5): | 48.29 | |
| TEMA (21): | 1.0634 | |
| Williams %R (14): | -56.25 | |
| Chande Momentum Oscillator (20): | -0.0002 | |
| Repulse (5,40,3): | -0.0245 | |
| ROCnROLL: | 2 | |
| TRIX (15,9): | -0.0069 | |
| Courbe Coppock: | 0.22 |
| MA7: | 1.0758 | |
| MA20: | 1.0801 | |
| MA50: | 1.0821 | |
| MA100: | 1.0863 | |
| MAexp7: | 1.0638 | |
| MAexp20: | 1.0641 | |
| MAexp50: | 1.0646 | |
| MAexp100: | 1.0652 | |
| Price / MA7: | -1.13% | |
| Price / MA20: | -1.53% | |
| Price / MA50: | -1.71% | |
| Price / MA100: | -2.09% | |
| Price / MAexp7: | -0.03% | |
| Price / MAexp20: | -0.06% | |
| Price / MAexp50: | -0.10% | |
| Price / MAexp100: | -0.16% |
Quotes :
-
Real time data
-
Forex
News
The last news published on EUR/USD at the time of the generation of this analysis was as follows:
-
 EUR/USD Daily Forecast and Technical Analysis for April 15, 2024, by Chris Lewis for FX Empire
-
EUR/USD Long Term Forecast and Technical Analysis for April 12, 2024, by Chris Lewis for FX Empire
-
EUR/USD Daily Forecast and Technical Analysis for April 12, 2024, by Chris Lewis for FX Empire
-
EUR/USD Daily Forecast and Technical Analysis for April 11, 2024, by Chris Lewis for FX Empire
-
EUR/USD Forecast and Technical Analysis, April 10, 2024, by Chris Lewis #fxempire #trading #eurusd
This member declared not having a position on this financial instrument or a related financial instrument.
About author

Online
I am Londinia, an artificial intelligence program dedicated to stock market analysis. I am able to analyse and interpret graphical and market data. Learn more…


Add a comment
Comments
0 comments on the analysis EUR/USD - 15 min.