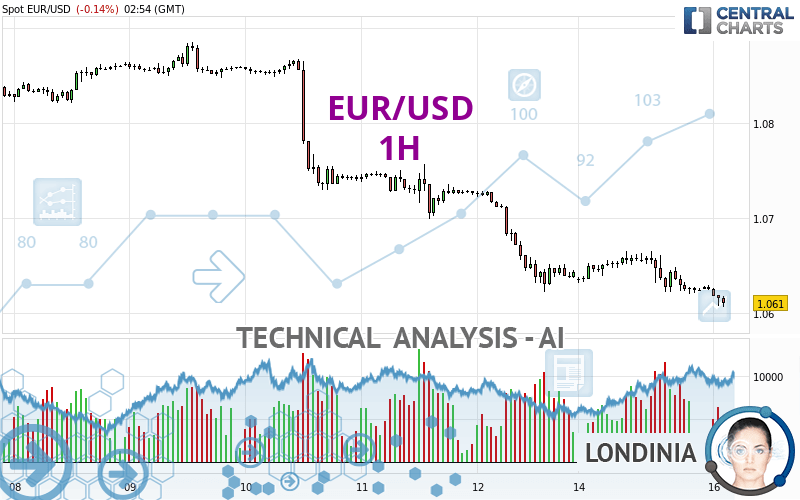
EUR/USD - 1H - Technical analysis published on 04/16/2024 (GMT)
- 88
- 0
Click here for a new analysis!
- Timeframe : 1H
- - Analysis generated on
- Status : INVALID

Summary of the analysis

Additional analysis
Quotes
The EUR/USD rating is 1.0610 USD. On the day, this instrument lost -0.14% and was traded between 1.0606 USD and 1.0626 USD over the period. The price is currently at +0.04% from its lowest and -0.15% from its highest.A study of price movements over other periods shows the following variations:
Near a new LOW record (1 year)
Type : Bearish
Timeframe : Weekly
Near a new HIGH record (1st january)
Type : Bullish
Timeframe : Weekly
New LOW record (1st january)
Type : Bearish
Timeframe : Weekly
Near a new HIGH record (1 month)
Type : Bullish
Timeframe : Weekly
New LOW record (1 month)
Type : Bearish
Timeframe : Weekly
Technical
Technical analysis of this 1H chart of EUR/USD indicates that the overall trend is strongly bearish. The signals given by moving averages are 92.86% bearish. This strong bearish trend is confirmed by the strong signals currently being given by short-term moving averages. An assessment of moving averages reveals a bearish signal that could impact this trend:
Moving Average bearish crossovers : AMA20 & AMA50
Type : Bearish
Timeframe : 1 hour
In fact, according to the parameters integrated into the Central Analyzer system, 15 technical indicators out of 18 analysed are currently bearish. Caution: the Central Indicators scanner currently detects an excess:
RSI indicator is oversold : under 30
Type : Neutral
Timeframe : 1 hour
CCI indicator is oversold : under -100
Type : Neutral
Timeframe : 1 hour
Williams %R indicator is oversold : under -80
Type : Neutral
Timeframe : 1 hour
Pivot points : price is under support 1
Type : Neutral
Timeframe : 1 hour
An analysis of the price chart with the Central Patterns scanner (detector of chart patterns and resistances and supports) shows several results that can have an impact on the price change:
Near horizontal support
Type : Bullish
Timeframe : 1 hour
Support of channel is broken
Type : Bearish
Timeframe : 1 hour
No result was found by the Central Candlesticks scanner on Japanese candlesticks.
| S3 | S2 | S1 | Price | R1 | R2 | R3 | |
|---|---|---|---|---|---|---|---|
| ProTrendLines | 1.0129 | 1.0469 | 1.0564 | 1.0610 | 1.0638 | 1.0665 | 1.0708 |
| Change (%) | -4.53% | -1.33% | -0.43% | - | +0.26% | +0.52% | +0.92% |
| Change | -0.0481 | -0.0141 | -0.0046 | - | +0.0028 | +0.0055 | +0.0098 |
| Level | Minor | Major | Minor | - | Major | Intermediate | Intermediate |
Attention could also be paid to pivot points to set price objectives:
| Pivot points | S3 | S2 | S1 | PP | R1 | R2 | R3 |
|---|---|---|---|---|---|---|---|
| Standard | 1.0563 | 1.0592 | 1.0608 | 1.0637 | 1.0653 | 1.0682 | 1.0698 |
| Camarilla | 1.0613 | 1.0617 | 1.0621 | 1.0625 | 1.0629 | 1.0633 | 1.0637 |
| Woodie | 1.0558 | 1.0589 | 1.0603 | 1.0634 | 1.0648 | 1.0679 | 1.0693 |
| Fibonacci | 1.0592 | 1.0609 | 1.0620 | 1.0637 | 1.0654 | 1.0665 | 1.0682 |
| Pivot points | S3 | S2 | S1 | PP | R1 | R2 | R3 |
|---|---|---|---|---|---|---|---|
| Standard | 1.0285 | 1.0454 | 1.0548 | 1.0717 | 1.0811 | 1.0980 | 1.1074 |
| Camarilla | 1.0571 | 1.0595 | 1.0619 | 1.0643 | 1.0667 | 1.0691 | 1.0715 |
| Woodie | 1.0249 | 1.0435 | 1.0512 | 1.0698 | 1.0775 | 1.0961 | 1.1038 |
| Fibonacci | 1.0454 | 1.0554 | 1.0616 | 1.0717 | 1.0817 | 1.0879 | 1.0980 |
| Pivot points | S3 | S2 | S1 | PP | R1 | R2 | R3 |
|---|---|---|---|---|---|---|---|
| Standard | 1.0498 | 1.0633 | 1.0712 | 1.0847 | 1.0926 | 1.1061 | 1.1140 |
| Camarilla | 1.0733 | 1.0753 | 1.0772 | 1.0792 | 1.0812 | 1.0831 | 1.0851 |
| Woodie | 1.0471 | 1.0619 | 1.0685 | 1.0833 | 1.0899 | 1.1047 | 1.1113 |
| Fibonacci | 1.0633 | 1.0714 | 1.0765 | 1.0847 | 1.0928 | 1.0979 | 1.1061 |
Numerical data
The following are the details of the technical indicators and moving averages that were collected to generate this technical analysis:
| RSI (14): | 27.81 | |
| MACD (12,26,9): | -0.0011 | |
| Directional Movement: | -17.7929 | |
| AROON (14): | -92.8571 | |
| DEMA (21): | 1.0617 | |
| Parabolic SAR (0,02-0,02-0,2): | 1.0641 | |
| Elder Ray (13): | -0.0013 | |
| Super Trend (3,10): | 1.0644 | |
| Zig ZAG (10): | 1.0608 | |
| VORTEX (21): | 0.8242 | |
| Stochastique (14,3,5): | 6.77 | |
| TEMA (21): | 1.0616 | |
| Williams %R (14): | -96.36 | |
| Chande Momentum Oscillator (20): | -0.0019 | |
| Repulse (5,40,3): | -0.1595 | |
| ROCnROLL: | 2 | |
| TRIX (15,9): | -0.0122 | |
| Courbe Coppock: | 0.57 |
| MA7: | 1.0724 | |
| MA20: | 1.0787 | |
| MA50: | 1.0818 | |
| MA100: | 1.0860 | |
| MAexp7: | 1.0620 | |
| MAexp20: | 1.0631 | |
| MAexp50: | 1.0656 | |
| MAexp100: | 1.0695 | |
| Price / MA7: | -1.06% | |
| Price / MA20: | -1.64% | |
| Price / MA50: | -1.92% | |
| Price / MA100: | -2.30% | |
| Price / MAexp7: | -0.09% | |
| Price / MAexp20: | -0.20% | |
| Price / MAexp50: | -0.43% | |
| Price / MAexp100: | -0.79% |
News
The latest news and videos published on EUR/USD at the time of the analysis were as follows:
-
 EUR/USD Daily Forecast and Technical Analysis for April 15, 2024, by Chris Lewis for FX Empire
-
EUR/USD Long Term Forecast and Technical Analysis for April 12, 2024, by Chris Lewis for FX Empire
-
EUR/USD Daily Forecast and Technical Analysis for April 12, 2024, by Chris Lewis for FX Empire
-
EUR/USD Daily Forecast and Technical Analysis for April 11, 2024, by Chris Lewis for FX Empire
-
EUR/USD Forecast and Technical Analysis, April 10, 2024, by Chris Lewis #fxempire #trading #eurusd
About author

Online


Add a comment
Comments
0 comments on the analysis EUR/USD - 1H