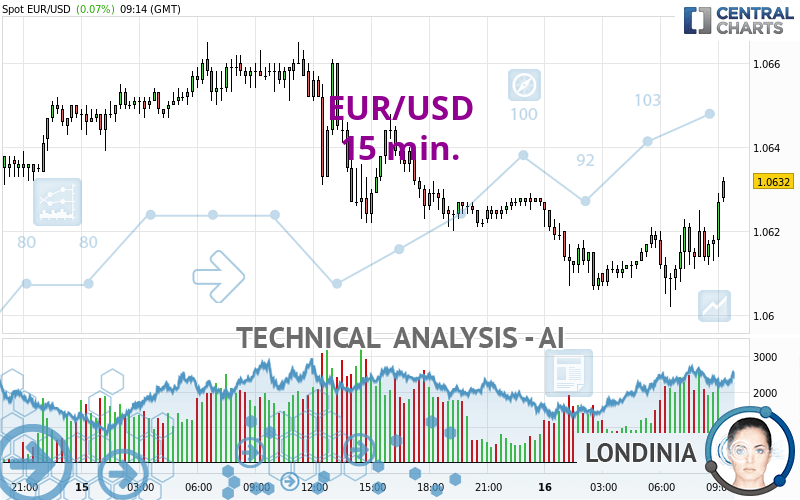
EUR/USD - 15 min. - Technical analysis published on 04/16/2024 (GMT)
- 104
- 0
Click here for a new analysis!
- Timeframe : 15 min.
- - Analysis generated on
- Status : TARGET REACHED

Summary of the analysis

Additional analysis
Quotes
The EUR/USD rating is 1.0633 USD. The price registered an increase of +0.08% on the session and was between 1.0602 USD and 1.0633 USD. This implies that the price is at +0.29% from its lowest and at 0% from its highest.So that you have an overall view of the price change, here is a table showing the variations over several periods:
Near a new LOW record (1 year)
Type : Bearish
Timeframe : Weekly
Near a new HIGH record (1st january)
Type : Bullish
Timeframe : Weekly
New LOW record (1st january)
Type : Bearish
Timeframe : Weekly
Near a new HIGH record (1 month)
Type : Bullish
Timeframe : Weekly
New LOW record (1 month)
Type : Bearish
Timeframe : Weekly
Technical
Technical analysis of EUR/USD in 15 min. shows an overall slightly bullish trend. 60.71% of the signals given by moving averages are bullish. This slightly bullish trend could be reinforced by the strong bullish signals given by short-term moving averages. The Central Indicators market scanner is currently detecting several bullish signals that could impact this trend:
Bullish price crossover with Moving Average 50
Type : Bullish
Timeframe : 15 minutes
Bullish price crossover with adaptative moving average 50
Type : Bullish
Timeframe : 15 minutes
Bullish price crossover with adaptative moving average 100
Type : Bullish
Timeframe : 15 minutes
In fact, 14 technical indicators on 18 studied are currently positioned bullish. Caution: the Central Indicators scanner currently detects an excess:
CCI indicator is overbought : over 100
Type : Neutral
Timeframe : 15 minutes
Williams %R indicator is overbought : over -20
Type : Neutral
Timeframe : 15 minutes
Ichimoku : price is over the cloud
Type : Bullish
Timeframe : 15 minutes
SuperTrend indicator bullish reversal
Type : Bullish
Timeframe : 15 minutes
MACD indicator is back over 0
Type : Bullish
Timeframe : 15 minutes
Momentum indicator is back over 0
Type : Bullish
Timeframe : 15 minutes
The Central Patterns scanner, which studies chart patterns, resistances and supports, has identified these signals:
Near horizontal resistance
Type : Bearish
Timeframe : 15 minutes
Resistance of channel is broken
Type : Bullish
Timeframe : 15 minutes
The Central Candlesticks scanner which studies Japanese candlesticks did not detect anything.
| S3 | S2 | S1 | Price | R1 | R2 | R3 | |
|---|---|---|---|---|---|---|---|
| ProTrendLines | 1.0129 | 1.0469 | 1.0564 | 1.0633 | 1.0638 | 1.0665 | 1.0708 |
| Change (%) | -4.74% | -1.54% | -0.65% | - | +0.05% | +0.30% | +0.71% |
| Change | -0.0504 | -0.0164 | -0.0069 | - | +0.0005 | +0.0032 | +0.0075 |
| Level | Minor | Major | Minor | - | Major | Intermediate | Intermediate |
Attention could also be paid to pivot points to set price objectives:
| Pivot points | S3 | S2 | S1 | PP | R1 | R2 | R3 |
|---|---|---|---|---|---|---|---|
| Standard | 1.0563 | 1.0592 | 1.0608 | 1.0637 | 1.0653 | 1.0682 | 1.0698 |
| Camarilla | 1.0613 | 1.0617 | 1.0621 | 1.0625 | 1.0629 | 1.0633 | 1.0637 |
| Woodie | 1.0558 | 1.0589 | 1.0603 | 1.0634 | 1.0648 | 1.0679 | 1.0693 |
| Fibonacci | 1.0592 | 1.0609 | 1.0620 | 1.0637 | 1.0654 | 1.0665 | 1.0682 |
| Pivot points | S3 | S2 | S1 | PP | R1 | R2 | R3 |
|---|---|---|---|---|---|---|---|
| Standard | 1.0285 | 1.0454 | 1.0548 | 1.0717 | 1.0811 | 1.0980 | 1.1074 |
| Camarilla | 1.0571 | 1.0595 | 1.0619 | 1.0643 | 1.0667 | 1.0691 | 1.0715 |
| Woodie | 1.0249 | 1.0435 | 1.0512 | 1.0698 | 1.0775 | 1.0961 | 1.1038 |
| Fibonacci | 1.0454 | 1.0554 | 1.0616 | 1.0717 | 1.0817 | 1.0879 | 1.0980 |
| Pivot points | S3 | S2 | S1 | PP | R1 | R2 | R3 |
|---|---|---|---|---|---|---|---|
| Standard | 1.0498 | 1.0633 | 1.0712 | 1.0847 | 1.0926 | 1.1061 | 1.1140 |
| Camarilla | 1.0733 | 1.0753 | 1.0772 | 1.0792 | 1.0812 | 1.0831 | 1.0851 |
| Woodie | 1.0471 | 1.0619 | 1.0685 | 1.0833 | 1.0899 | 1.1047 | 1.1113 |
| Fibonacci | 1.0633 | 1.0714 | 1.0765 | 1.0847 | 1.0928 | 1.0979 | 1.1061 |
Numerical data
The following is the status of the technical indicators and moving averages at the time of publication of this technical analysis:
| RSI (14): | 65.27 | |
| MACD (12,26,9): | 0.0001 | |
| Directional Movement: | 12.5975 | |
| AROON (14): | 71.4286 | |
| DEMA (21): | 1.0617 | |
| Parabolic SAR (0,02-0,02-0,2): | 1.0607 | |
| Elder Ray (13): | 0.0006 | |
| Super Trend (3,10): | 1.0600 | |
| Zig ZAG (10): | 1.0629 | |
| VORTEX (21): | 1.0526 | |
| Stochastique (14,3,5): | 72.46 | |
| TEMA (21): | 1.0620 | |
| Williams %R (14): | -3.57 | |
| Chande Momentum Oscillator (20): | 0.0018 | |
| Repulse (5,40,3): | 0.1359 | |
| ROCnROLL: | 1 | |
| TRIX (15,9): | -0.0005 | |
| Courbe Coppock: | 0.09 |
| MA7: | 1.0727 | |
| MA20: | 1.0789 | |
| MA50: | 1.0818 | |
| MA100: | 1.0860 | |
| MAexp7: | 1.0619 | |
| MAexp20: | 1.0616 | |
| MAexp50: | 1.0619 | |
| MAexp100: | 1.0627 | |
| Price / MA7: | -0.88% | |
| Price / MA20: | -1.45% | |
| Price / MA50: | -1.71% | |
| Price / MA100: | -2.09% | |
| Price / MAexp7: | +0.13% | |
| Price / MAexp20: | +0.16% | |
| Price / MAexp50: | +0.13% | |
| Price / MAexp100: | +0.06% |
News
The last news published on EUR/USD at the time of the generation of this analysis was as follows:
-
 EUR/USD Daily Forecast and Technical Analysis for April 15, 2024, by Chris Lewis for FX Empire
-
EUR/USD Long Term Forecast and Technical Analysis for April 12, 2024, by Chris Lewis for FX Empire
-
EUR/USD Daily Forecast and Technical Analysis for April 12, 2024, by Chris Lewis for FX Empire
-
EUR/USD Daily Forecast and Technical Analysis for April 11, 2024, by Chris Lewis for FX Empire
-
EUR/USD Forecast and Technical Analysis, April 10, 2024, by Chris Lewis #fxempire #trading #eurusd
About author

Online


Add a comment
Comments
0 comments on the analysis EUR/USD - 15 min.