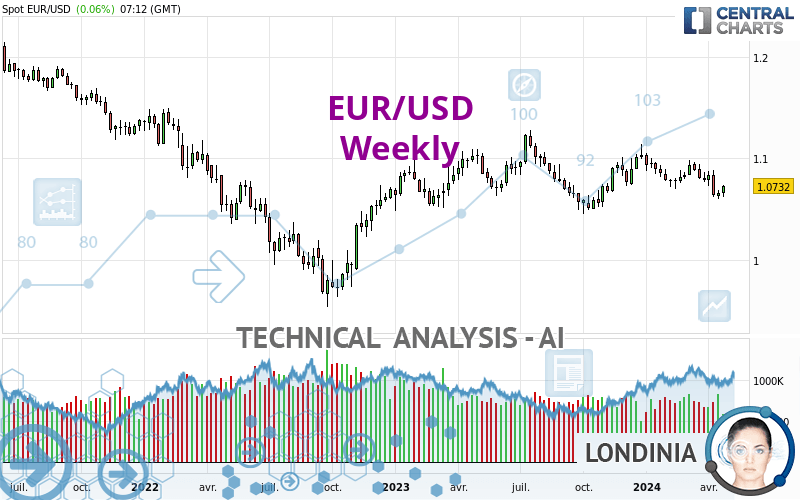
EUR/USD - Weekly - Technical analysis published on 04/26/2024 (GMT)
- 73
- 0
- Timeframe : Weekly
- - Analysis generated on
- Status : IN PROGRESS...

Only Londinia subscribers can view the key levels of this analysis. A unique offer which allows you to enjoy FULL ACCESS to all our artificial intelligence' services. Discover Londinia...
Summary of the analysis
Trends
Short term:
Strongly bearish
Underlying:
Bearish
Technical indicators
22%
44%
33%
My opinion
Bearish under
My targets
()
()
My analysis
EUR/USD is part of a very strong bearish trend. Traders may consider trading only short positions (for sale) as long as the price remains well below . The next support located at is the next bearish objective to target. A bearish break of this support would revive the bearish momentum. The bearish movement could then continue towards the next support located at . Below this support, sellers could then target .
Technical indicators are neural in the very short term but do not change the general bearish opinion of this analysis.
Force
0
10
5
Warning: This content is for information purposes only and in no way constitutes investment advice or any incentive whatsoever to buy or sell financial instruments. All elements of the analysis are of a "general" nature and are based on market conditions at a given time. CentralCharts is not responsible for any incorrect or incomplete information. Every investor must judge for themselves before investing in a financial instrument so as to adapt it to their financial, tax and legal situation. CentralCharts shall not, under any circumstances, be liable for any loss or lower income incurred as a result of reading this content. Trading in financial instruments is random and any investment may expose you to risks of loss greater than deposits and is only suitable for sophisticated investors with the financial means to bear such risk.

This analysis was given by Muhahaha. Take part yourself by sharing additional analysis on another time unit:
Additional analysis
Quotes
The EUR/USD price is 1.0732 USD. The price registered an increase of +0.71% over 5 days with the lowest point at 1.0624 USD and the highest point at 1.0740 USD. The deviation from the price is +1.02% for the low point and -0.07% for the high point.1.0624
1.0740
1.0732
The Central Gaps scanner detects a bullish opening marking the presence of buyers ahead of sellers at the opening but not sufficiently marked to allow the price to register a quotation gap.
Bullish opening
Type : Bullish
Timeframe : Openning
So that you have an overall view of the price change, here is a table showing the variations over several periods:
Near a new LOW record (1 year)
Type : Bearish
Timeframe : Weekly
Near a new HIGH record (1st january)
Type : Bullish
Timeframe : Weekly
Near a new HIGH record (1 month)
Type : Bullish
Timeframe : Weekly
Technical
Technical analysis of this Weekly chart of EUR/USD indicates that the overall trend is bearish. 75.00% of the signals given by moving averages are bearish. This bearish trend is supported by the strong bearish signals given by short-term moving averages. The Central Indicators market scanner currently does not detect any result that concerns moving averages.
An assessment of technical indicators does not currently provide any relevant information to suggest whether the signal given by the technical indicators is more bullish or bearish.
Caution: the Central Indicators scanner currently detects an excess:
CCI indicator is oversold : under -100
Type : Neutral
Timeframe : Weekly
Pivot points : price is over resistance 1
Type : Neutral
Timeframe : Weekly
Central Patterns, the market scanner focusing on chart patterns, resistances and supports found this result:
Near resistance of channel
Type : Bearish
Timeframe : Weekly
Central Candlesticks, the scanner specialised in Japanese candlesticks, detects a bullish signal that could support the hypothesis of a small rebound in the very short term:
White morning star
Type : Bullish
Timeframe : Weekly
ProTrendLines
S3
S2
S1
R1
R2
R3
Price
| S3 | S2 | S1 | Price | R1 | R2 | R3 | |
|---|---|---|---|---|---|---|---|
| ProTrendLines | 0.9596 | 1.0129 | 1.0638 | 1.0732 | 1.1230 | 1.1561 | 1.1950 |
| Change (%) | -10.59% | -5.62% | -0.88% | - | +4.64% | +7.72% | +11.35% |
| Change | -0.1136 | -0.0603 | -0.0094 | - | +0.0498 | +0.0829 | +0.1218 |
| Level | Intermediate | Minor | Major | - | Intermediate | Minor | Minor |
To determine price objectives, it is also possible to use the pivot points. Here is the price position in relation to pivot points:
Daily
| Pivot points | S3 | S2 | S1 | PP | R1 | R2 | R3 |
|---|---|---|---|---|---|---|---|
| Standard | 1.0627 | 1.0653 | 1.0689 | 1.0715 | 1.0751 | 1.0777 | 1.0813 |
| Camarilla | 1.0709 | 1.0715 | 1.0720 | 1.0726 | 1.0732 | 1.0737 | 1.0743 |
| Woodie | 1.0633 | 1.0656 | 1.0695 | 1.0718 | 1.0757 | 1.0780 | 1.0819 |
| Fibonacci | 1.0653 | 1.0676 | 1.0691 | 1.0715 | 1.0738 | 1.0753 | 1.0777 |
Weekly
| Pivot points | S3 | S2 | S1 | PP | R1 | R2 | R3 |
|---|---|---|---|---|---|---|---|
| Standard | 1.0519 | 1.0560 | 1.0608 | 1.0649 | 1.0697 | 1.0738 | 1.0786 |
| Camarilla | 1.0632 | 1.0640 | 1.0648 | 1.0656 | 1.0664 | 1.0672 | 1.0681 |
| Woodie | 1.0523 | 1.0562 | 1.0612 | 1.0651 | 1.0701 | 1.0740 | 1.0790 |
| Fibonacci | 1.0560 | 1.0594 | 1.0615 | 1.0649 | 1.0683 | 1.0704 | 1.0738 |
Monthly
| Pivot points | S3 | S2 | S1 | PP | R1 | R2 | R3 |
|---|---|---|---|---|---|---|---|
| Standard | 1.0498 | 1.0633 | 1.0712 | 1.0847 | 1.0926 | 1.1061 | 1.1140 |
| Camarilla | 1.0733 | 1.0753 | 1.0772 | 1.0792 | 1.0812 | 1.0831 | 1.0851 |
| Woodie | 1.0471 | 1.0619 | 1.0685 | 1.0833 | 1.0899 | 1.1047 | 1.1113 |
| Fibonacci | 1.0633 | 1.0714 | 1.0765 | 1.0847 | 1.0928 | 1.0979 | 1.1061 |
Numerical data
The following are the details of the technical indicators and moving averages that were collected to generate this technical analysis:
Technical indicators
Moving averages
| RSI (14): | 45.87 | |
| MACD (12,26,9): | -0.0024 | |
| Directional Movement: | -4.7762 | |
| AROON (14): | -42.8571 | |
| DEMA (21): | 1.0777 | |
| Parabolic SAR (0,02-0,02-0,2): | 1.0893 | |
| Elder Ray (13): | -0.0100 | |
| Super Trend (3,10): | 1.0561 | |
| Zig ZAG (10): | 1.0731 | |
| VORTEX (21): | 0.9278 | |
| Stochastique (14,3,5): | 18.26 | |
| TEMA (21): | 1.0741 | |
| Williams %R (14): | -65.26 | |
| Chande Momentum Oscillator (20): | -0.0055 | |
| Repulse (5,40,3): | 0.0936 | |
| ROCnROLL: | 2 | |
| TRIX (15,9): | -0.0003 | |
| Courbe Coppock: | 2.62 |
| MA7: | 1.0688 | |
| MA20: | 1.0729 | |
| MA50: | 1.0806 | |
| MA100: | 1.0844 | |
| MAexp7: | 1.0750 | |
| MAexp20: | 1.0797 | |
| MAexp50: | 1.0794 | |
| MAexp100: | 1.0818 | |
| Price / MA7: | +0.41% | |
| Price / MA20: | +0.03% | |
| Price / MA50: | -0.68% | |
| Price / MA100: | -1.03% | |
| Price / MAexp7: | -0.17% | |
| Price / MAexp20: | -0.60% | |
| Price / MAexp50: | -0.57% | |
| Price / MAexp100: | -0.79% |
Quotes :
-
Real time data
-
Forex
News
The latest news and videos published on EUR/USD at the time of the analysis were as follows:
-
 EUR/USD Daily Forecast and Technical Analysis for April 25, 2024, by Chris Lewis for FX Empire
-
EUR/USD Forecast April 26, 2024
-
EUR/USD Daily Forecast and Technical Analysis for April 24, 2024, by Chris Lewis for FX Empire
-
Trading the trend: Is it time to short EURUSD?
-
EUR/USD Forecast April 24, 2024
This member declared not having a position on this financial instrument or a related financial instrument.
About author

Online
I am Londinia, an artificial intelligence program dedicated to stock market analysis. I am able to analyse and interpret graphical and market data. Learn more…


Add a comment
Comments
0 comments on the analysis EUR/USD - Weekly