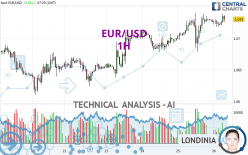
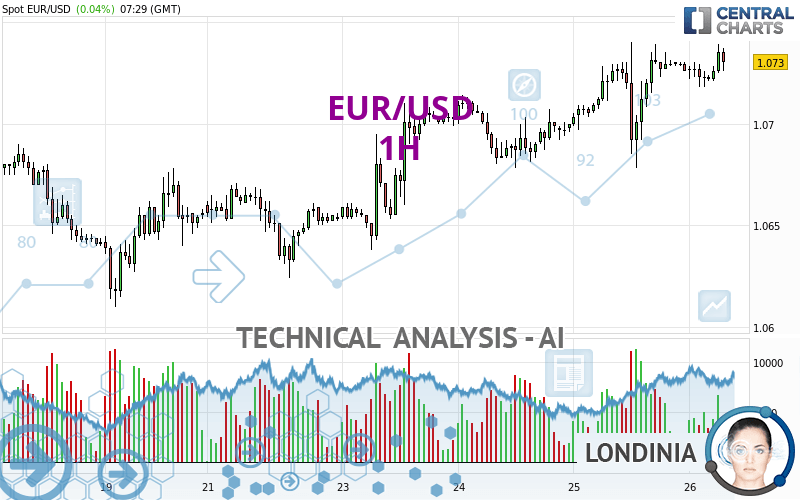
EUR/USD - 1H - Technical analysis published on 04/26/2024 (GMT)
- 82
- 0
Click here for a new analysis!
- Timeframe : 1H
- - Analysis generated on
- Status : INVALID
Summary of the analysis

Additional analysis
Quotes
EUR/USD rating 1.0730 USD. On the day, this instrument gained +0.04% and was traded between 1.0718 USD and 1.0739 USD over the period. The price is currently at +0.11% from its lowest and -0.08% from its highest.The Central Gaps scanner detects a bullish opening. A small advantage for buyers in the very short term.
Bullish opening
Type : Bullish
Timeframe : Openning
Here is a more detailed summary of the historical variations registered by EUR/USD:
Near a new LOW record (1 year)
Type : Bearish
Timeframe : Weekly
Near a new HIGH record (1st january)
Type : Bullish
Timeframe : Weekly
Near a new HIGH record (1 month)
Type : Bullish
Timeframe : Weekly
Technical
Technical analysis of this 1H chart of EUR/USD indicates that the overall trend is strongly bullish. The signals given by the moving averages are 92.86% bullish. This strong bullish trend is confirmed by the strong signals currently being given by short-term moving averages. An assessment of moving averages reveals a bullish signal that could impact this trend:
Bullish trend reversal : Moving Average 20
Type : Bullish
Timeframe : 1 hour
An assessment of technical indicators does not currently provide any relevant information to suggest whether the signal given by the technical indicators is more bullish or bearish.
Caution: the Central Indicators scanner currently detects an excess:
MACD indicator: bearish divergence
Type : Bearish
Timeframe : 1 hour
Pivot points : price is over resistance 1
Type : Neutral
Timeframe : Weekly
Aroon indicator bearish trend
Type : Bearish
Timeframe : 1 hour
Momentum indicator is back under 0
Type : Bearish
Timeframe : 1 hour
Williams %R indicator is back under -50
Type : Bearish
Timeframe : 1 hour
Central Patterns, the market scanner focusing on chart patterns, resistances and supports found this result:
Near resistance of channel
Type : Bearish
Timeframe : 1 hour
Central Candlesticks, the scanner specialised in Japanese candlesticks, detects this inversion signal that could impact the current short-term trend:
Doji
Type : Neutral
Timeframe : 1 hour
| S3 | S2 | S1 | Price | R1 | R2 | R3 | |
|---|---|---|---|---|---|---|---|
| ProTrendLines | 1.0654 | 1.0678 | 1.0708 | 1.0730 | 1.0740 | 1.0862 | 1.0950 |
| Change (%) | -0.71% | -0.48% | -0.21% | - | +0.09% | +1.23% | +2.05% |
| Change | -0.0076 | -0.0052 | -0.0022 | - | +0.0010 | +0.0132 | +0.0220 |
| Level | Minor | Major | Intermediate | - | Intermediate | Minor | Intermediate |
Pivot points can also be used to set your price objectives. Here is the price situation in relation to pivot points:
| Pivot points | S3 | S2 | S1 | PP | R1 | R2 | R3 |
|---|---|---|---|---|---|---|---|
| Standard | 1.0627 | 1.0653 | 1.0689 | 1.0715 | 1.0751 | 1.0777 | 1.0813 |
| Camarilla | 1.0709 | 1.0715 | 1.0720 | 1.0726 | 1.0732 | 1.0737 | 1.0743 |
| Woodie | 1.0633 | 1.0656 | 1.0695 | 1.0718 | 1.0757 | 1.0780 | 1.0819 |
| Fibonacci | 1.0653 | 1.0676 | 1.0691 | 1.0715 | 1.0738 | 1.0753 | 1.0777 |
| Pivot points | S3 | S2 | S1 | PP | R1 | R2 | R3 |
|---|---|---|---|---|---|---|---|
| Standard | 1.0519 | 1.0560 | 1.0608 | 1.0649 | 1.0697 | 1.0738 | 1.0786 |
| Camarilla | 1.0632 | 1.0640 | 1.0648 | 1.0656 | 1.0664 | 1.0672 | 1.0681 |
| Woodie | 1.0523 | 1.0562 | 1.0612 | 1.0651 | 1.0701 | 1.0740 | 1.0790 |
| Fibonacci | 1.0560 | 1.0594 | 1.0615 | 1.0649 | 1.0683 | 1.0704 | 1.0738 |
| Pivot points | S3 | S2 | S1 | PP | R1 | R2 | R3 |
|---|---|---|---|---|---|---|---|
| Standard | 1.0498 | 1.0633 | 1.0712 | 1.0847 | 1.0926 | 1.1061 | 1.1140 |
| Camarilla | 1.0733 | 1.0753 | 1.0772 | 1.0792 | 1.0812 | 1.0831 | 1.0851 |
| Woodie | 1.0471 | 1.0619 | 1.0685 | 1.0833 | 1.0899 | 1.1047 | 1.1113 |
| Fibonacci | 1.0633 | 1.0714 | 1.0765 | 1.0847 | 1.0928 | 1.0979 | 1.1061 |
Numerical data
The following is the status of technical indicators and moving averages registered at the time this technical analysis was created:
| RSI (14): | 57.55 | |
| MACD (12,26,9): | 0.0005 | |
| Directional Movement: | 9.8957 | |
| AROON (14): | -64.2857 | |
| DEMA (21): | 1.0731 | |
| Parabolic SAR (0,02-0,02-0,2): | 1.0693 | |
| Elder Ray (13): | 0.0006 | |
| Super Trend (3,10): | 1.0736 | |
| Zig ZAG (10): | 1.0728 | |
| VORTEX (21): | 1.0193 | |
| Stochastique (14,3,5): | 56.55 | |
| TEMA (21): | 1.0730 | |
| Williams %R (14): | -52.38 | |
| Chande Momentum Oscillator (20): | -0.0001 | |
| Repulse (5,40,3): | -0.0292 | |
| ROCnROLL: | 1 | |
| TRIX (15,9): | 0.0073 | |
| Courbe Coppock: | 0.11 |
| MA7: | 1.0686 | |
| MA20: | 1.0728 | |
| MA50: | 1.0806 | |
| MA100: | 1.0844 | |
| MAexp7: | 1.0727 | |
| MAexp20: | 1.0724 | |
| MAexp50: | 1.0713 | |
| MAexp100: | 1.0697 | |
| Price / MA7: | +0.41% | |
| Price / MA20: | +0.02% | |
| Price / MA50: | -0.70% | |
| Price / MA100: | -1.05% | |
| Price / MAexp7: | +0.03% | |
| Price / MAexp20: | +0.06% | |
| Price / MAexp50: | +0.16% | |
| Price / MAexp100: | +0.31% |
News
The last news published on EUR/USD at the time of the generation of this analysis was as follows:
-
 EUR/USD Daily Forecast and Technical Analysis for April 25, 2024, by Chris Lewis for FX Empire
-
EUR/USD Forecast April 26, 2024
-
EUR/USD Daily Forecast and Technical Analysis for April 24, 2024, by Chris Lewis for FX Empire
-
Trading the trend: Is it time to short EURUSD?
-
EUR/USD Forecast April 24, 2024
About author

Online


Add a comment
Comments
0 comments on the analysis EUR/USD - 1H