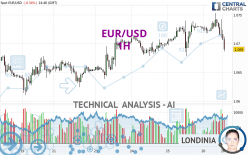
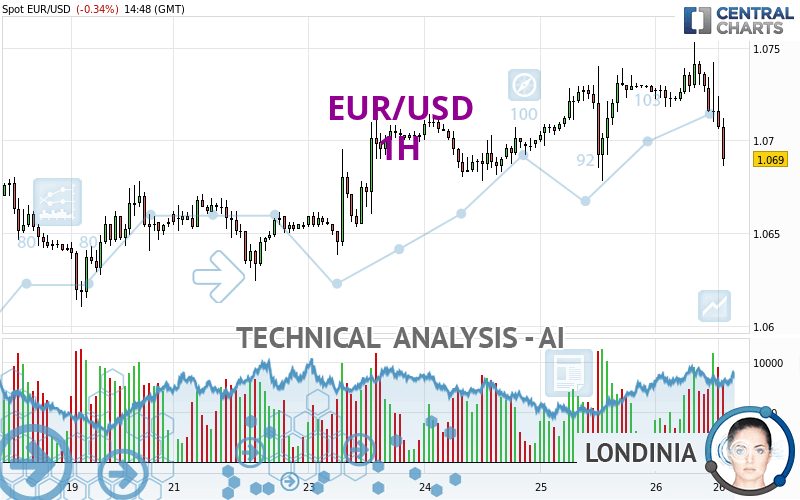
EUR/USD - 1H - Technical analysis published on 04/26/2024 (GMT)
- 78
- 0
Click here for a new analysis!
- Timeframe : 1H
- - Analysis generated on
- Status : INVALID
Summary of the analysis

Additional analysis
Quotes
The EUR/USD rating is 1.0690 USD. The price registered a decrease of -0.34% on the session and was between 1.0686 USD and 1.0753 USD. This implies that the price is at +0.04% from its lowest and at -0.59% from its highest.A bullish opening was detected by the Central Gaps scanner. Buyers are trying to impose a bullish momentum in the very short term.
Bullish opening
Type : Bullish
Timeframe : Openning
A study of price movements over other periods shows the following variations:
Near a new HIGH record (1 year)
Type : Bullish
Timeframe : Weekly
Near a new HIGH record (1st january)
Type : Bullish
Timeframe : Weekly
Near a new HIGH record (1 month)
Type : Bullish
Timeframe : Weekly
Technical
Technical analysis of this 1H chart of EUR/USD indicates that the overall trend is slightly bearish. 53.57% of the signals given by moving averages are bearish. This slightly bearish trend could be reinforced by the strong bearish signals given by short-term moving averages. An assessment of moving averages reveals several bearish signals that could impact this trend:
Bearish trend reversal : adaptative moving average 50
Type : Bearish
Timeframe : 1 hour
Bearish price crossover with Moving Average 100
Type : Bearish
Timeframe : 1 hour
Bearish price crossover with adaptative moving average 100
Type : Bearish
Timeframe : 1 hour
Technical indicators are strongly bearish, suggesting that the price decline is expected to continue.
Caution: the Central Indicators scanner currently detects an excess:
CCI indicator is oversold : under -100
Type : Neutral
Timeframe : 1 hour
Williams %R indicator is oversold : under -80
Type : Neutral
Timeframe : 1 hour
Pivot points : price is under support 1
Type : Neutral
Timeframe : 1 hour
Parabolic SAR indicator bearish reversal
Type : Bearish
Timeframe : 1 hour
Ichimoku : price is under the cloud
Type : Bearish
Timeframe : 1 hour
MACD indicator is back under 0
Type : Bearish
Timeframe : 1 hour
An analysis of the price chart with the Central Patterns scanner (detector of chart patterns and resistances and supports) shows a result that can have an impact on the price change:
Near resistance of triangle
Type : Bearish
Timeframe : 1 hour
The Central Candlesticks scanner which studies Japanese candlesticks did not detect anything.
| S3 | S2 | S1 | Price | R1 | R2 | R3 | |
|---|---|---|---|---|---|---|---|
| ProTrendLines | 1.0638 | 1.0654 | 1.0678 | 1.0690 | 1.0708 | 1.0740 | 1.0862 |
| Change (%) | -0.49% | -0.34% | -0.11% | - | +0.17% | +0.47% | +1.61% |
| Change | -0.0052 | -0.0036 | -0.0012 | - | +0.0018 | +0.0050 | +0.0172 |
| Level | Major | Minor | Major | - | Intermediate | Intermediate | Minor |
Pivot points can also be used to set your price objectives. Here is the price situation in relation to pivot points:
| Pivot points | S3 | S2 | S1 | PP | R1 | R2 | R3 |
|---|---|---|---|---|---|---|---|
| Standard | 1.0627 | 1.0653 | 1.0689 | 1.0715 | 1.0751 | 1.0777 | 1.0813 |
| Camarilla | 1.0709 | 1.0715 | 1.0720 | 1.0726 | 1.0732 | 1.0737 | 1.0743 |
| Woodie | 1.0633 | 1.0656 | 1.0695 | 1.0718 | 1.0757 | 1.0780 | 1.0819 |
| Fibonacci | 1.0653 | 1.0676 | 1.0691 | 1.0715 | 1.0738 | 1.0753 | 1.0777 |
| Pivot points | S3 | S2 | S1 | PP | R1 | R2 | R3 |
|---|---|---|---|---|---|---|---|
| Standard | 1.0519 | 1.0560 | 1.0608 | 1.0649 | 1.0697 | 1.0738 | 1.0786 |
| Camarilla | 1.0632 | 1.0640 | 1.0648 | 1.0656 | 1.0664 | 1.0672 | 1.0681 |
| Woodie | 1.0523 | 1.0562 | 1.0612 | 1.0651 | 1.0701 | 1.0740 | 1.0790 |
| Fibonacci | 1.0560 | 1.0594 | 1.0615 | 1.0649 | 1.0683 | 1.0704 | 1.0738 |
| Pivot points | S3 | S2 | S1 | PP | R1 | R2 | R3 |
|---|---|---|---|---|---|---|---|
| Standard | 1.0498 | 1.0633 | 1.0712 | 1.0847 | 1.0926 | 1.1061 | 1.1140 |
| Camarilla | 1.0733 | 1.0753 | 1.0772 | 1.0792 | 1.0812 | 1.0831 | 1.0851 |
| Woodie | 1.0471 | 1.0619 | 1.0685 | 1.0833 | 1.0899 | 1.1047 | 1.1113 |
| Fibonacci | 1.0633 | 1.0714 | 1.0765 | 1.0847 | 1.0928 | 1.0979 | 1.1061 |
Numerical data
The following is the status of technical indicators and moving averages registered at the time this technical analysis was created:
| RSI (14): | 31.32 | |
| MACD (12,26,9): | -0.0002 | |
| Directional Movement: | -3.2063 | |
| AROON (14): | -42.8571 | |
| DEMA (21): | 1.0720 | |
| Parabolic SAR (0,02-0,02-0,2): | 1.0753 | |
| Elder Ray (13): | -0.0018 | |
| Super Trend (3,10): | 1.0746 | |
| Zig ZAG (10): | 1.0689 | |
| VORTEX (21): | 0.8255 | |
| Stochastique (14,3,5): | 6.39 | |
| TEMA (21): | 1.0713 | |
| Williams %R (14): | -98.46 | |
| Chande Momentum Oscillator (20): | -0.0035 | |
| Repulse (5,40,3): | -0.4746 | |
| ROCnROLL: | 2 | |
| TRIX (15,9): | 0.0040 | |
| Courbe Coppock: | 0.20 |
| MA7: | 1.0681 | |
| MA20: | 1.0727 | |
| MA50: | 1.0805 | |
| MA100: | 1.0843 | |
| MAexp7: | 1.0713 | |
| MAexp20: | 1.0720 | |
| MAexp50: | 1.0714 | |
| MAexp100: | 1.0700 | |
| Price / MA7: | +0.08% | |
| Price / MA20: | -0.34% | |
| Price / MA50: | -1.06% | |
| Price / MA100: | -1.41% | |
| Price / MAexp7: | -0.21% | |
| Price / MAexp20: | -0.28% | |
| Price / MAexp50: | -0.22% | |
| Price / MAexp100: | -0.09% |
News
The last news published on EUR/USD at the time of the generation of this analysis was as follows:
-
 EUR/USD Long Term Forecast and Technical Analysis for April 26, 2024, by Chris Lewis for FX Empire
-
EUR/USD Daily Forecast and Technical Analysis for April 26, 2024, by Chris Lewis for FX Empire
-
EUR/USD Daily Forecast and Technical Analysis for April 25, 2024, by Chris Lewis for FX Empire
-
EUR/USD Forecast April 26, 2024
-
EUR/USD Daily Forecast and Technical Analysis for April 24, 2024, by Chris Lewis for FX Empire
About author

Online


Add a comment
Comments
0 comments on the analysis EUR/USD - 1H