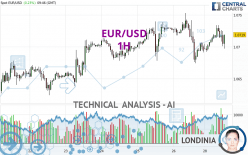
EUR/USD - 1H - Technical analysis published on 04/29/2024 (GMT)
- 68
- 0
Click here for a new analysis!
- Timeframe : 1H
- - Analysis generated on
- Status : INVALID

Summary of the analysis

Additional analysis
Quotes
EUR/USD rating 1.0719 USD. The price registered an increase of +0.23% on the session and was traded between 1.0692 USD and 1.0734 USD over the period. The price is currently at +0.25% from its lowest and -0.14% from its highest.The Central Gaps scanner detects a bullish opening. A small advantage for buyers in the very short term.
Bullish opening
Type : Bullish
Timeframe : Openning
A study of price movements over other periods shows the following variations:
Near a new LOW record (1 year)
Type : Bearish
Timeframe : Weekly
Near a new HIGH record (1st january)
Type : Bullish
Timeframe : Weekly
Near a new HIGH record (1 month)
Type : Bullish
Timeframe : Weekly
Technical
A technical analysis in 1H of this EUR/USD chart shows a bullish trend. 71.43% of the signals given by moving averages are bullish. This bullish trend shows slight signs of slowing down given the slightly bullish signals given by the short-term moving averages. The Central Indicators scanner detects bullish signals on moving averages that could impact this trend:
Bullish price crossover with Moving Average 20
Type : Bullish
Timeframe : 1 hour
Bullish price crossover with Moving Average 100
Type : Bullish
Timeframe : 1 hour
Bullish price crossover with adaptative moving average 20
Type : Bullish
Timeframe : 1 hour
Bullish price crossover with adaptative moving average 50
Type : Bullish
Timeframe : 1 hour
An assessment of technical indicators shows a moderate bullish signal.
Central Indicators, the detector scanner for these technical indicators has recently detected several signals:
RSI indicator is back over 50
Type : Bullish
Timeframe : 1 hour
Williams %R indicator is back over -50
Type : Bullish
Timeframe : 1 hour
Central Patterns, the scanner specializing in chart patterns, did not identify any signals.
No result was found by the Central Candlesticks scanner on Japanese candlesticks.
| S3 | S2 | S1 | Price | R1 | R2 | R3 | |
|---|---|---|---|---|---|---|---|
| ProTrendLines | 1.0664 | 1.0678 | 1.0708 | 1.0719 | 1.0740 | 1.0753 | 1.0765 |
| Change (%) | -0.51% | -0.38% | -0.10% | - | +0.20% | +0.32% | +0.43% |
| Change | -0.0055 | -0.0041 | -0.0011 | - | +0.0021 | +0.0034 | +0.0046 |
| Level | Minor | Major | Major | - | Minor | Intermediate | Minor |
To determine price objectives, it is also possible to use the pivot points. Here is the price position in relation to pivot points:
| Pivot points | S3 | S2 | S1 | PP | R1 | R2 | R3 |
|---|---|---|---|---|---|---|---|
| Standard | 1.0582 | 1.0628 | 1.0661 | 1.0707 | 1.0740 | 1.0786 | 1.0819 |
| Camarilla | 1.0672 | 1.0680 | 1.0687 | 1.0694 | 1.0701 | 1.0709 | 1.0716 |
| Woodie | 1.0576 | 1.0625 | 1.0655 | 1.0704 | 1.0734 | 1.0783 | 1.0813 |
| Fibonacci | 1.0628 | 1.0658 | 1.0677 | 1.0707 | 1.0737 | 1.0756 | 1.0786 |
| Pivot points | S3 | S2 | S1 | PP | R1 | R2 | R3 |
|---|---|---|---|---|---|---|---|
| Standard | 1.0499 | 1.0561 | 1.0628 | 1.0690 | 1.0757 | 1.0819 | 1.0886 |
| Camarilla | 1.0659 | 1.0670 | 1.0682 | 1.0694 | 1.0706 | 1.0718 | 1.0730 |
| Woodie | 1.0501 | 1.0562 | 1.0630 | 1.0691 | 1.0759 | 1.0820 | 1.0888 |
| Fibonacci | 1.0561 | 1.0611 | 1.0641 | 1.0690 | 1.0740 | 1.0770 | 1.0819 |
| Pivot points | S3 | S2 | S1 | PP | R1 | R2 | R3 |
|---|---|---|---|---|---|---|---|
| Standard | 1.0498 | 1.0633 | 1.0712 | 1.0847 | 1.0926 | 1.1061 | 1.1140 |
| Camarilla | 1.0733 | 1.0753 | 1.0772 | 1.0792 | 1.0812 | 1.0831 | 1.0851 |
| Woodie | 1.0471 | 1.0619 | 1.0685 | 1.0833 | 1.0899 | 1.1047 | 1.1113 |
| Fibonacci | 1.0633 | 1.0714 | 1.0765 | 1.0847 | 1.0928 | 1.0979 | 1.1061 |
Numerical data
The following are the details of the technical indicators and moving averages that were collected to generate this technical analysis:
| RSI (14): | 48.16 | |
| MACD (12,26,9): | 0.0001 | |
| Directional Movement: | -2.6911 | |
| AROON (14): | 64.2857 | |
| DEMA (21): | 1.0712 | |
| Parabolic SAR (0,02-0,02-0,2): | 1.0680 | |
| Elder Ray (13): | -0.0008 | |
| Super Trend (3,10): | 1.0732 | |
| Zig ZAG (10): | 1.0714 | |
| VORTEX (21): | 0.9599 | |
| Stochastique (14,3,5): | 49.24 | |
| TEMA (21): | 1.0715 | |
| Williams %R (14): | -45.24 | |
| Chande Momentum Oscillator (20): | 0.0020 | |
| Repulse (5,40,3): | 0.0296 | |
| ROCnROLL: | 1 | |
| TRIX (15,9): | -0.0009 | |
| Courbe Coppock: | 0.36 |
| MA7: | 1.0693 | |
| MA20: | 1.0725 | |
| MA50: | 1.0803 | |
| MA100: | 1.0842 | |
| MAexp7: | 1.0715 | |
| MAexp20: | 1.0712 | |
| MAexp50: | 1.0711 | |
| MAexp100: | 1.0702 | |
| Price / MA7: | +0.24% | |
| Price / MA20: | -0.06% | |
| Price / MA50: | -0.78% | |
| Price / MA100: | -1.13% | |
| Price / MAexp7: | +0.04% | |
| Price / MAexp20: | +0.07% | |
| Price / MAexp50: | +0.07% | |
| Price / MAexp100: | +0.16% |
News
Don't forget to follow the news on EUR/USD. At the time of publication of this analysis, the latest news was as follows:
-
 EUR/USD Long Term Forecast and Technical Analysis for April 26, 2024, by Chris Lewis for FX Empire
-
EUR/USD Daily Forecast and Technical Analysis for April 26, 2024, by Chris Lewis for FX Empire
-
EUR/USD Daily Forecast and Technical Analysis for April 25, 2024, by Chris Lewis for FX Empire
-
EUR/USD Forecast April 26, 2024
-
EUR/USD Daily Forecast and Technical Analysis for April 24, 2024, by Chris Lewis for FX Empire
About author

Online


Add a comment
Comments
0 comments on the analysis EUR/USD - 1H