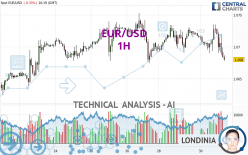
EUR/USD - 1H - Technical analysis published on 04/30/2024 (GMT)
- 87
- 0
Click here for a new analysis!
- Timeframe : 1H
- - Analysis generated on
- Status : LEVEL MAINTAINED

Summary of the analysis

Additional analysis
Quotes
The EUR/USD price is 1.0680 USD. The price registered a decrease of -0.33% on the session and was traded between 1.0678 USD and 1.0735 USD over the period. The price is currently at +0.02% from its lowest and -0.51% from its highest.A study of price movements over other periods shows the following variations:
Near a new LOW record (1 year)
Type : Bearish
Timeframe : Weekly
Near a new HIGH record (1st january)
Type : Bullish
Timeframe : Weekly
Near a new HIGH record (1 month)
Type : Bullish
Timeframe : Weekly
Technical
Technical analysis of EUR/USD in 1H shows an overall bearish trend. 78.57% of the signals given by moving averages are bearish. The overall trend is reinforced by the strong bearish signals from short-term moving averages. An assessment of moving averages reveals a bearish signal that could impact this trend:
Bearish trend reversal : Moving Average 100
Type : Bearish
Timeframe : 1 hour
In fact, Central Analyzer took into account 18 technical indicators and the result was as follows: 4 are bullish, 2 are neutral and 12 are bearish. Caution: the Central Indicators scanner currently detects an excess:
CCI indicator is oversold : under -100
Type : Neutral
Timeframe : 1 hour
RSI indicator: bullish divergence
Type : Bullish
Timeframe : 1 hour
Williams %R indicator is oversold : under -80
Type : Neutral
Timeframe : 1 hour
Pivot points : price is under support 1
Type : Neutral
Timeframe : 1 hour
Price is back under the pivot point
Type : Bearish
Timeframe : Weekly
Central Patterns, the market scanner focusing on chart patterns, resistances and supports found these results:
Near horizontal support
Type : Bullish
Timeframe : 1 hour
Support of channel is broken
Type : Bearish
Timeframe : 1 hour
The Central Candlesticks scanner currently notes the presence of this pattern in Japanese candlesticks that could mark the end of the short-term trend currently underway:
Doji
Type : Neutral
Timeframe : 1 hour
| S3 | S2 | S1 | Price | R1 | R2 | R3 | |
|---|---|---|---|---|---|---|---|
| ProTrendLines | 1.0624 | 1.0638 | 1.0678 | 1.0680 | 1.0708 | 1.0734 | 1.0753 |
| Change (%) | -0.52% | -0.39% | -0.02% | - | +0.26% | +0.51% | +0.68% |
| Change | -0.0056 | -0.0042 | -0.0002 | - | +0.0028 | +0.0054 | +0.0073 |
| Level | Minor | Major | Major | - | Intermediate | Minor | Intermediate |
Pivot points can also be used to set your price objectives. Here is the price situation in relation to pivot points:
| Pivot points | S3 | S2 | S1 | PP | R1 | R2 | R3 |
|---|---|---|---|---|---|---|---|
| Standard | 1.0648 | 1.0669 | 1.0692 | 1.0713 | 1.0736 | 1.0757 | 1.0780 |
| Camarilla | 1.0703 | 1.0707 | 1.0711 | 1.0715 | 1.0719 | 1.0723 | 1.0727 |
| Woodie | 1.0649 | 1.0670 | 1.0693 | 1.0714 | 1.0737 | 1.0758 | 1.0781 |
| Fibonacci | 1.0669 | 1.0686 | 1.0696 | 1.0713 | 1.0730 | 1.0740 | 1.0757 |
| Pivot points | S3 | S2 | S1 | PP | R1 | R2 | R3 |
|---|---|---|---|---|---|---|---|
| Standard | 1.0499 | 1.0561 | 1.0628 | 1.0690 | 1.0757 | 1.0819 | 1.0886 |
| Camarilla | 1.0659 | 1.0670 | 1.0682 | 1.0694 | 1.0706 | 1.0718 | 1.0730 |
| Woodie | 1.0501 | 1.0562 | 1.0630 | 1.0691 | 1.0759 | 1.0820 | 1.0888 |
| Fibonacci | 1.0561 | 1.0611 | 1.0641 | 1.0690 | 1.0740 | 1.0770 | 1.0819 |
| Pivot points | S3 | S2 | S1 | PP | R1 | R2 | R3 |
|---|---|---|---|---|---|---|---|
| Standard | 1.0498 | 1.0633 | 1.0712 | 1.0847 | 1.0926 | 1.1061 | 1.1140 |
| Camarilla | 1.0733 | 1.0753 | 1.0772 | 1.0792 | 1.0812 | 1.0831 | 1.0851 |
| Woodie | 1.0471 | 1.0619 | 1.0685 | 1.0833 | 1.0899 | 1.1047 | 1.1113 |
| Fibonacci | 1.0633 | 1.0714 | 1.0765 | 1.0847 | 1.0928 | 1.0979 | 1.1061 |
Numerical data
The following are the details of the technical indicators and moving averages that were collected to generate this technical analysis:
| RSI (14): | 36.47 | |
| MACD (12,26,9): | -0.0005 | |
| Directional Movement: | -17.5931 | |
| AROON (14): | -50.0000 | |
| DEMA (21): | 1.0699 | |
| Parabolic SAR (0,02-0,02-0,2): | 1.0728 | |
| Elder Ray (13): | -0.0019 | |
| Super Trend (3,10): | 1.0730 | |
| Zig ZAG (10): | 1.0681 | |
| VORTEX (21): | 0.8674 | |
| Stochastique (14,3,5): | 5.84 | |
| TEMA (21): | 1.0694 | |
| Williams %R (14): | -94.55 | |
| Chande Momentum Oscillator (20): | -0.0022 | |
| Repulse (5,40,3): | -0.2142 | |
| ROCnROLL: | 2 | |
| TRIX (15,9): | -0.0028 | |
| Courbe Coppock: | 0.22 |
| MA7: | 1.0696 | |
| MA20: | 1.0722 | |
| MA50: | 1.0801 | |
| MA100: | 1.0842 | |
| MAexp7: | 1.0695 | |
| MAexp20: | 1.0706 | |
| MAexp50: | 1.0709 | |
| MAexp100: | 1.0706 | |
| Price / MA7: | -0.15% | |
| Price / MA20: | -0.39% | |
| Price / MA50: | -1.12% | |
| Price / MA100: | -1.49% | |
| Price / MAexp7: | -0.14% | |
| Price / MAexp20: | -0.24% | |
| Price / MAexp50: | -0.27% | |
| Price / MAexp100: | -0.24% |
News
Don't forget to follow the news on EUR/USD. At the time of publication of this analysis, the latest news was as follows:
-
 EUR/USD Daily Forecast and Technical Analysis for April 30, 2024, by Chris Lewis for FX Empire
-
Weekly Technical Outlook: 29/04/2024 - USDJPY, EURUSD, Oil
-
EUR/USD Daily Forecast and Technical Analysis for April 29, 2024, by Chris Lewis for FX Empire
-
EUR/USD Long Term Forecast and Technical Analysis for April 26, 2024, by Chris Lewis for FX Empire
-
EUR/USD Daily Forecast and Technical Analysis for April 26, 2024, by Chris Lewis for FX Empire
About author

Online


Add a comment
Comments
0 comments on the analysis EUR/USD - 1H