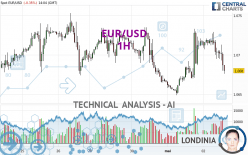
EUR/USD - 1H - Technical analysis published on 05/02/2024 (GMT)
- 88
- 0
Click here for a new analysis!
- Timeframe : 1H
- - Analysis generated on
- Status : INVALID

Summary of the analysis

Additional analysis
Quotes
EUR/USD rating 1.0681 USD. The price registered a decrease of -0.34% on the session with the lowest point at 1.0676 USD and the highest point at 1.0729 USD. The deviation from the price is +0.05% for the low point and -0.45% for the high point.So that you have an overall view of the price change, here is a table showing the variations over several periods:
Near a new LOW record (1 year)
Type : Bearish
Timeframe : Weekly
Near a new HIGH record (1st january)
Type : Bullish
Timeframe : Weekly
Near a new HIGH record (1 month)
Type : Bullish
Timeframe : Weekly
Technical
A technical analysis in 1H of this EUR/USD chart shows a bearish trend. 71.43% of the signals given by moving averages are bearish. This bearish trend is slowing down slightly given the slightly bearish signals given by short-term moving averages. The Central Indicators scanner detects bearish signals on moving averages that could impact this trend:
Bearish trend reversal : adaptative moving average 50
Type : Bearish
Timeframe : 1 hour
Bearish trend reversal : adaptative moving average 100
Type : Bearish
Timeframe : 1 hour
Bearish price crossover with Moving Average 50
Type : Bearish
Timeframe : 1 hour
Bearish price crossover with Moving Average 100
Type : Bearish
Timeframe : 1 hour
Bearish price crossover with adaptative moving average 20
Type : Bearish
Timeframe : 1 hour
Bearish price crossover with adaptative moving average 50
Type : Bearish
Timeframe : 1 hour
In fact, only 9 technical indicators out of 18 studied are currently positioned bearish. Caution: the Central Indicators scanner currently detects an excess:
CCI indicator is oversold : under -100
Type : Neutral
Timeframe : 1 hour
Williams %R indicator is oversold : under -80
Type : Neutral
Timeframe : 1 hour
SuperTrend indicator bearish reversal
Type : Bearish
Timeframe : 1 hour
Price is back under the pivot point
Type : Bearish
Timeframe : 1 hour
Price is back under the pivot point
Type : Bearish
Timeframe : Weekly
No signals are given by Central Patterns, a market scanner specialised in chart patterns, resistances and supports.
The Central Candlesticks scanner which studies Japanese candlesticks did not detect anything.
| S3 | S2 | S1 | Price | R1 | R2 | R3 | |
|---|---|---|---|---|---|---|---|
| ProTrendLines | 1.0638 | 1.0649 | 1.0678 | 1.0681 | 1.0708 | 1.0735 | 1.0753 |
| Change (%) | -0.40% | -0.30% | -0.03% | - | +0.25% | +0.51% | +0.67% |
| Change | -0.0043 | -0.0032 | -0.0003 | - | +0.0027 | +0.0054 | +0.0072 |
| Level | Major | Minor | Intermediate | - | Intermediate | Intermediate | Minor |
To determine price objectives, it is also possible to use the pivot points. Here is the price position in relation to pivot points:
| Pivot points | S3 | S2 | S1 | PP | R1 | R2 | R3 |
|---|---|---|---|---|---|---|---|
| Standard | 1.0582 | 1.0616 | 1.0666 | 1.0700 | 1.0750 | 1.0784 | 1.0834 |
| Camarilla | 1.0694 | 1.0702 | 1.0709 | 1.0717 | 1.0725 | 1.0732 | 1.0740 |
| Woodie | 1.0591 | 1.0620 | 1.0675 | 1.0704 | 1.0759 | 1.0788 | 1.0843 |
| Fibonacci | 1.0616 | 1.0648 | 1.0668 | 1.0700 | 1.0732 | 1.0752 | 1.0784 |
| Pivot points | S3 | S2 | S1 | PP | R1 | R2 | R3 |
|---|---|---|---|---|---|---|---|
| Standard | 1.0499 | 1.0561 | 1.0628 | 1.0690 | 1.0757 | 1.0819 | 1.0886 |
| Camarilla | 1.0659 | 1.0670 | 1.0682 | 1.0694 | 1.0706 | 1.0718 | 1.0730 |
| Woodie | 1.0501 | 1.0562 | 1.0630 | 1.0691 | 1.0759 | 1.0820 | 1.0888 |
| Fibonacci | 1.0561 | 1.0611 | 1.0641 | 1.0690 | 1.0740 | 1.0770 | 1.0819 |
| Pivot points | S3 | S2 | S1 | PP | R1 | R2 | R3 |
|---|---|---|---|---|---|---|---|
| Standard | 1.0266 | 1.0433 | 1.0550 | 1.0717 | 1.0834 | 1.1001 | 1.1118 |
| Camarilla | 1.0588 | 1.0614 | 1.0640 | 1.0666 | 1.0692 | 1.0718 | 1.0744 |
| Woodie | 1.0240 | 1.0421 | 1.0524 | 1.0705 | 1.0808 | 1.0989 | 1.1092 |
| Fibonacci | 1.0433 | 1.0542 | 1.0609 | 1.0717 | 1.0826 | 1.0893 | 1.1001 |
Numerical data
The following is the status of technical indicators and moving averages registered at the time this technical analysis was created:
| RSI (14): | 38.88 | |
| MACD (12,26,9): | 0.0002 | |
| Directional Movement: | -1.9225 | |
| AROON (14): | -42.8571 | |
| DEMA (21): | 1.0707 | |
| Parabolic SAR (0,02-0,02-0,2): | 1.0726 | |
| Elder Ray (13): | -0.0012 | |
| Super Trend (3,10): | 1.0683 | |
| Zig ZAG (10): | 1.0684 | |
| VORTEX (21): | 1.0284 | |
| Stochastique (14,3,5): | 16.31 | |
| TEMA (21): | 1.0706 | |
| Williams %R (14): | -91.84 | |
| Chande Momentum Oscillator (20): | -0.0032 | |
| Repulse (5,40,3): | -0.2307 | |
| ROCnROLL: | 2 | |
| TRIX (15,9): | 0.0097 | |
| Courbe Coppock: | 0.15 |
| MA7: | 1.0700 | |
| MA20: | 1.0707 | |
| MA50: | 1.0796 | |
| MA100: | 1.0840 | |
| MAexp7: | 1.0700 | |
| MAexp20: | 1.0702 | |
| MAexp50: | 1.0698 | |
| MAexp100: | 1.0697 | |
| Price / MA7: | -0.18% | |
| Price / MA20: | -0.24% | |
| Price / MA50: | -1.07% | |
| Price / MA100: | -1.47% | |
| Price / MAexp7: | -0.19% | |
| Price / MAexp20: | -0.21% | |
| Price / MAexp50: | -0.17% | |
| Price / MAexp100: | -0.16% |
News
The last news published on EUR/USD at the time of the generation of this analysis was as follows:
-
 EUR/USD Forecast May 3, 2024
-
EUR/USD Daily Forecast and Technical Analysis for May 02, 2024, by Chris Lewis for FX Empire
-
EUR/USD Daily Forecast and Technical Analysis for May 01, 2024, by Chris Lewis for FX Empire
-
EUR/USD Daily Forecast and Technical Analysis for April 30, 2024, by Chris Lewis for FX Empire
-
Weekly Technical Outlook: 29/04/2024 - USDJPY, EURUSD, Oil
About author

Online


Add a comment
Comments
0 comments on the analysis EUR/USD - 1H