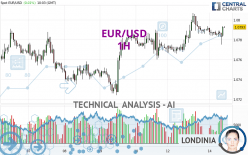
EUR/USD - 1H - Technical analysis published on 05/14/2024 (GMT)
- 56
- 0
Click here for a new analysis!
- Timeframe : 1H
- - Analysis generated on
- Status : TARGET REACHED

Summary of the analysis

Additional analysis
Quotes
EUR/USD rating 1.0793 USD. The price registered an increase of +0.01% on the session and was between 1.0775 USD and 1.0794 USD. This implies that the price is at +0.17% from its lowest and at -0.01% from its highest.So that you have an overall view of the price change, here is a table showing the variations over several periods:
Near a new HIGH record (1 year)
Type : Bullish
Timeframe : Weekly
Near a new HIGH record (1st january)
Type : Bullish
Timeframe : Weekly
Near a new LOW record (1 month)
Type : Bearish
Timeframe : Weekly
Technical
Technical analysis of this 1H chart of EUR/USD indicates that the overall trend is strongly bullish. 89.29% of the signals given by moving averages are bullish. The slightly bullish signals given by the short-term moving averages show a weakening of the global trend. The Central Indicators scanner detects bullish signals on moving averages that could impact this trend:
Bullish trend reversal : adaptative moving average 20
Type : Bullish
Timeframe : 1 hour
Bullish price crossover with Moving Average 20
Type : Bullish
Timeframe : 1 hour
Bullish price crossover with adaptative moving average 20
Type : Bullish
Timeframe : 1 hour
In fact, 11 technical indicators on 18 studied are currently bullish. Caution: the Central Indicators scanner currently detects an excess:
Williams %R indicator is overbought : over -20
Type : Neutral
Timeframe : 1 hour
RSI indicator is back over 50
Type : Bullish
Timeframe : 1 hour
Price is back over the pivot point
Type : Bullish
Timeframe : 1 hour
Momentum indicator is back over 0
Type : Bullish
Timeframe : 1 hour
Central Patterns, the market scanner focusing on chart patterns, resistances and supports found these results:
Near horizontal support
Type : Bullish
Timeframe : 1 hour
Support of channel is broken
Type : Bearish
Timeframe : 1 hour
For a small rebound in the very short term, the Central Candlesticks scanner currently notes the presence of this bullish pattern in Japanese candlesticks:
Bullish harami
Type : Bullish
Timeframe : 1 hour
| S3 | S2 | S1 | Price | R1 | R2 | R3 | |
|---|---|---|---|---|---|---|---|
| ProTrendLines | 1.0724 | 1.0765 | 1.0791 | 1.0793 | 1.0813 | 1.0862 | 1.0953 |
| Change (%) | -0.64% | -0.26% | -0.02% | - | +0.19% | +0.64% | +1.48% |
| Change | -0.0069 | -0.0028 | -0.0002 | - | +0.0020 | +0.0069 | +0.0160 |
| Level | Intermediate | Intermediate | Minor | - | Intermediate | Minor | Major |
Pivot points can also be used to set your price objectives. Here is the price situation in relation to pivot points:
| Pivot points | S3 | S2 | S1 | PP | R1 | R2 | R3 |
|---|---|---|---|---|---|---|---|
| Standard | 1.0729 | 1.0747 | 1.0770 | 1.0788 | 1.0811 | 1.0829 | 1.0852 |
| Camarilla | 1.0781 | 1.0785 | 1.0788 | 1.0792 | 1.0796 | 1.0800 | 1.0803 |
| Woodie | 1.0731 | 1.0748 | 1.0772 | 1.0789 | 1.0813 | 1.0830 | 1.0854 |
| Fibonacci | 1.0747 | 1.0763 | 1.0773 | 1.0788 | 1.0804 | 1.0814 | 1.0829 |
| Pivot points | S3 | S2 | S1 | PP | R1 | R2 | R3 |
|---|---|---|---|---|---|---|---|
| Standard | 1.0666 | 1.0695 | 1.0733 | 1.0762 | 1.0800 | 1.0829 | 1.0867 |
| Camarilla | 1.0753 | 1.0759 | 1.0765 | 1.0771 | 1.0777 | 1.0783 | 1.0789 |
| Woodie | 1.0671 | 1.0697 | 1.0738 | 1.0764 | 1.0805 | 1.0831 | 1.0872 |
| Fibonacci | 1.0695 | 1.0721 | 1.0736 | 1.0762 | 1.0788 | 1.0803 | 1.0829 |
| Pivot points | S3 | S2 | S1 | PP | R1 | R2 | R3 |
|---|---|---|---|---|---|---|---|
| Standard | 1.0266 | 1.0433 | 1.0550 | 1.0717 | 1.0834 | 1.1001 | 1.1118 |
| Camarilla | 1.0588 | 1.0614 | 1.0640 | 1.0666 | 1.0692 | 1.0718 | 1.0744 |
| Woodie | 1.0240 | 1.0421 | 1.0524 | 1.0705 | 1.0808 | 1.0989 | 1.1092 |
| Fibonacci | 1.0433 | 1.0542 | 1.0609 | 1.0717 | 1.0826 | 1.0893 | 1.1001 |
Numerical data
The following is the status of technical indicators and moving averages registered at the time this technical analysis was created:
| RSI (14): | 57.93 | |
| MACD (12,26,9): | 0.0001 | |
| Directional Movement: | -2.1551 | |
| AROON (14): | -64.2857 | |
| DEMA (21): | 1.0790 | |
| Parabolic SAR (0,02-0,02-0,2): | 1.0798 | |
| Elder Ray (13): | 0.0001 | |
| Super Trend (3,10): | 1.0776 | |
| Zig ZAG (10): | 1.0793 | |
| VORTEX (21): | 0.9549 | |
| Stochastique (14,3,5): | 57.74 | |
| TEMA (21): | 1.0788 | |
| Williams %R (14): | -5.26 | |
| Chande Momentum Oscillator (20): | 0.0003 | |
| Repulse (5,40,3): | 0.1128 | |
| ROCnROLL: | 1 | |
| TRIX (15,9): | 0.0028 | |
| Courbe Coppock: | 0.10 |
| MA7: | 1.0772 | |
| MA20: | 1.0722 | |
| MA50: | 1.0786 | |
| MA100: | 1.0826 | |
| MAexp7: | 1.0788 | |
| MAexp20: | 1.0787 | |
| MAexp50: | 1.0782 | |
| MAexp100: | 1.0773 | |
| Price / MA7: | +0.19% | |
| Price / MA20: | +0.66% | |
| Price / MA50: | +0.06% | |
| Price / MA100: | -0.30% | |
| Price / MAexp7: | +0.05% | |
| Price / MAexp20: | +0.06% | |
| Price / MAexp50: | +0.10% | |
| Price / MAexp100: | +0.19% |
News
Don't forget to follow the news on EUR/USD. At the time of publication of this analysis, the latest news was as follows:
-
 EUR/USD Daily Forecast and Technical Analysis for May 13, 2024, by Chris Lewis for FX Empire
-
Trading volatility: EURUSD to move around US CPI inflation data?
-
EUR/USD Long Term Forecast and Technical Analysis for May 10, 2024, by Chris Lewis for FX Empire
-
EUR/USD Daily Forecast and Technical Analysis for May 10, 2024, by Chris Lewis for FX Empire
-
EUR/USD Daily Forecast and Technical Analysis for May 09, 2024, by Chris Lewis for FX Empire
About author

Online


Add a comment
Comments
0 comments on the analysis EUR/USD - 1H