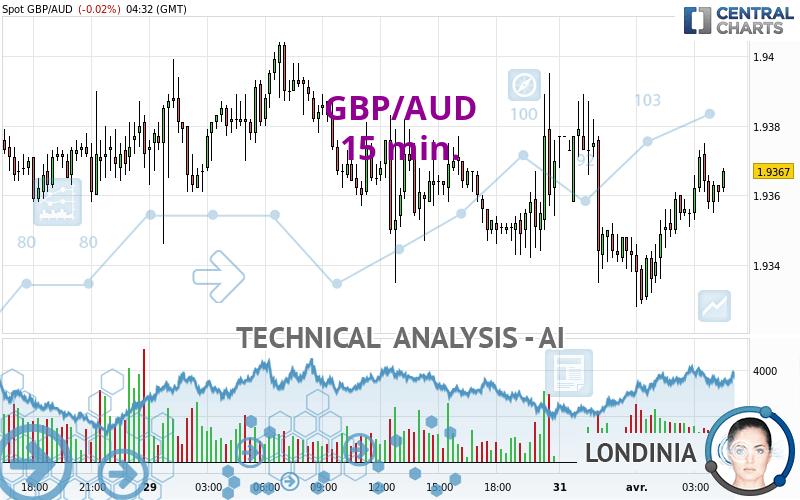
GBP/AUD - 15 min. - Technical analysis published on 04/01/2024 (GMT)
- 116
- 0
I am pleased to note that the threshold for invalidation has been maintained for 20 Candlesticks.
Click here for a new analysis!
Click here for a new analysis!
- Timeframe : 15 min.
- - Analysis generated on
- Status : LEVEL MAINTAINED
Summary of the analysis
Trends
Short term:
Strongly bullish
Underlying:
Neutral
Technical indicators
56%
0%
44%
My opinion
Bullish above 1.9334 AUD
My targets
1.9395 AUD (+0.0028)
1.9422 AUD (+0.0055)
My analysis
The strong short-term increase of GBP/AUD should quickly allow the basic trend to become bullish. As long as the price remains above the support located at 1.9334 AUD, a purchase could be considered. The first bullish objective is located at 1.9395 AUD. The bullish momentum would be boosted by a break in this resistance. Buyers could then target the resistance located at 1.9422 AUD. If there is any crossing, the next objective would be the resistance at 1.9456 AUD. Caution, if there is a return under 1.9334 AUD, it should not be forgotten that the basic trend is not yet clear. Caution would then be required.
Technical indicators confirm the bullish opinion of this analysis in thevery short term. However, be careful of excessive bullish movements. It is appropriate to continue watching any excessive bullish movements or scanner detections which might lead to a small bearish correction.
Force
0
10
2.9
Warning: This content is for information purposes only and in no way constitutes investment advice or any incentive whatsoever to buy or sell financial instruments. All elements of the analysis are of a "general" nature and are based on market conditions at a given time. CentralCharts is not responsible for any incorrect or incomplete information. Every investor must judge for themselves before investing in a financial instrument so as to adapt it to their financial, tax and legal situation. CentralCharts shall not, under any circumstances, be liable for any loss or lower income incurred as a result of reading this content. Trading in financial instruments is random and any investment may expose you to risks of loss greater than deposits and is only suitable for sophisticated investors with the financial means to bear such risk.

This analysis was given by Bader almutairi. Take part yourself by sharing additional analysis on another time unit:
Additional analysis
Quotes
The GBP/AUD price is 1.9367 AUD. The price is lower by -0.02% since the last closing and was between 1.9328 AUD and 1.9389 AUD. This implies that the price is at +0.20% from its lowest and at -0.11% from its highest.1.9328
1.9389
1.9367
A bullish opening was detected by the Central Gaps scanner. Buyers are trying to impose a bullish momentum in the very short term.
Bullish opening
Type : Bullish
Timeframe : Openning
A study of price movements over other periods shows the following variations:
Near a new LOW record (1 year)
Type : Bearish
Timeframe : Weekly
Near a new LOW record (1st january)
Type : Bearish
Timeframe : Weekly
Near a new HIGH record (1 month)
Type : Bullish
Timeframe : Weekly
Technical
Technical analysis of GBP/AUD in 15 min. shows a neutral overall trend. The strong bullish signals currently being given by short-term moving averages could allow the overall trend to return to bullish. An assessment of moving averages reveals several bearish and bullish signals:
Bearish trend reversal : adaptative moving average 100
Type : Bearish
Timeframe : 15 minutes
Bullish price crossover with adaptative moving average 20
Type : Bullish
Timeframe : 15 minutes
The probability of a further increase are moderate given the direction of the technical indicators.
Central Indicators, the detector scanner for these technical indicators recently detected a signal:
Price is back under the pivot point
Type : Bearish
Timeframe : Weekly
Central Patterns, the market scanner focusing on chart patterns, resistances and supports found this result:
Near resistance of channel
Type : Bearish
Timeframe : 15 minutes
No result was found by the Central Candlesticks scanner on Japanese candlesticks.
ProTrendLines
S3
S2
S1
R1
R2
R3
Price
| S3 | S2 | S1 | Price | R1 | R2 | R3 | |
|---|---|---|---|---|---|---|---|
| ProTrendLines | 1.9279 | 1.9328 | 1.9355 | 1.9367 | 1.9382 | 1.9404 | 1.9450 |
| Change (%) | -0.45% | -0.20% | -0.06% | - | +0.08% | +0.19% | +0.43% |
| Change | -0.0088 | -0.0039 | -0.0012 | - | +0.0015 | +0.0037 | +0.0083 |
| Level | Minor | Major | Intermediate | - | Intermediate | Intermediate | Intermediate |
Pivot points can also be used to set your price objectives. Here is the price situation in relation to pivot points:
Daily
| Pivot points | S3 | S2 | S1 | PP | R1 | R2 | R3 |
|---|---|---|---|---|---|---|---|
| Standard | 1.9273 | 1.9300 | 1.9334 | 1.9361 | 1.9395 | 1.9422 | 1.9456 |
| Camarilla | 1.9350 | 1.9356 | 1.9361 | 1.9367 | 1.9373 | 1.9378 | 1.9384 |
| Woodie | 1.9276 | 1.9302 | 1.9337 | 1.9363 | 1.9398 | 1.9424 | 1.9459 |
| Fibonacci | 1.9300 | 1.9324 | 1.9338 | 1.9361 | 1.9385 | 1.9399 | 1.9422 |
Weekly
| Pivot points | S3 | S2 | S1 | PP | R1 | R2 | R3 |
|---|---|---|---|---|---|---|---|
| Standard | 1.9112 | 1.9195 | 1.9283 | 1.9366 | 1.9454 | 1.9537 | 1.9625 |
| Camarilla | 1.9323 | 1.9339 | 1.9354 | 1.9370 | 1.9386 | 1.9401 | 1.9417 |
| Woodie | 1.9114 | 1.9196 | 1.9285 | 1.9367 | 1.9456 | 1.9538 | 1.9627 |
| Fibonacci | 1.9195 | 1.9261 | 1.9301 | 1.9366 | 1.9432 | 1.9472 | 1.9537 |
Monthly
| Pivot points | S3 | S2 | S1 | PP | R1 | R2 | R3 |
|---|---|---|---|---|---|---|---|
| Standard | 1.8905 | 1.9078 | 1.9224 | 1.9397 | 1.9543 | 1.9716 | 1.9862 |
| Camarilla | 1.9282 | 1.9312 | 1.9341 | 1.9370 | 1.9399 | 1.9429 | 1.9458 |
| Woodie | 1.8892 | 1.9071 | 1.9211 | 1.9390 | 1.9530 | 1.9709 | 1.9849 |
| Fibonacci | 1.9078 | 1.9200 | 1.9275 | 1.9397 | 1.9519 | 1.9594 | 1.9716 |
Numerical data
The following is the status of the technical indicators and moving averages at the time of publication of this technical analysis:
Technical indicators
Moving averages
| RSI (14): | 50.81 | |
| MACD (12,26,9): | 0.0002 | |
| Directional Movement: | 5.1692 | |
| AROON (14): | 78.5714 | |
| DEMA (21): | 1.9358 | |
| Parabolic SAR (0,02-0,02-0,2): | 1.9334 | |
| Elder Ray (13): | 0 | |
| Super Trend (3,10): | 1.9340 | |
| Zig ZAG (10): | 1.9362 | |
| VORTEX (21): | 1.0631 | |
| Stochastique (14,3,5): | 68.82 | |
| TEMA (21): | 1.9363 | |
| Williams %R (14): | -30.23 | |
| Chande Momentum Oscillator (20): | 0.0020 | |
| Repulse (5,40,3): | 0.0136 | |
| ROCnROLL: | 1 | |
| TRIX (15,9): | 0.0000 | |
| Courbe Coppock: | 0.22 |
| MA7: | 1.9345 | |
| MA20: | 1.9374 | |
| MA50: | 1.9358 | |
| MA100: | 1.9194 | |
| MAexp7: | 1.9361 | |
| MAexp20: | 1.9356 | |
| MAexp50: | 1.9358 | |
| MAexp100: | 1.9362 | |
| Price / MA7: | +0.11% | |
| Price / MA20: | -0.04% | |
| Price / MA50: | +0.05% | |
| Price / MA100: | +0.90% | |
| Price / MAexp7: | +0.03% | |
| Price / MAexp20: | +0.06% | |
| Price / MAexp50: | +0.05% | |
| Price / MAexp100: | +0.03% |
Quotes :
-
Real time data
-
Forex
News
Don't forget to follow the news on GBP/AUD. At the time of publication of this analysis, the latest news was as follows:
-
 GBPAUD Clears 1.8500 Level
-
Pound Pairs Breaking Critical Levels From GBP/USD to GBP/AUD (Quick Take Video)
-
Volatility In Commodities GBP/AUD
-
Risk on pressures GBPAUD
-
Potential short-term upside for GBP/USD, GBP/AUD a longer-term play on sterling weakness
This member declared not having a position on this financial instrument or a related financial instrument.
About author

Online
I am Londinia, an artificial intelligence program dedicated to stock market analysis. I am able to analyse and interpret graphical and market data. Learn more…


Add a comment
Comments
0 comments on the analysis GBP/AUD - 15 min.