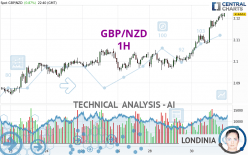
GBP/NZD - 1H - Technical analysis published on 04/30/2024 (GMT)
- 131
- 0
Click here for a new analysis!
- Timeframe : 1H
- - Analysis generated on
- Status : INVALID

Summary of the analysis

Additional analysis
Quotes
The GBP/NZD rating is 2.1221 NZD. The price registered an increase of +0.88% on the session and was traded between 2.1022 NZD and 2.1223 NZD over the period. The price is currently at +0.95% from its lowest and -0.01% from its highest.The Central Gaps scanner detects a bullish opening. A small advantage for buyers in the very short term.
Bullish opening
Type : Bullish
Timeframe : Openning
So that you have an overall view of the price change, here is a table showing the variations over several periods:
Near a new HIGH record (5 years)
Type : Bullish
Timeframe : Weekly
Near a new HIGH record (1 year)
Type : Bullish
Timeframe : Weekly
New HIGH record (1st january)
Type : Bullish
Timeframe : Weekly
New HIGH record (1 month)
Type : Bullish
Timeframe : Weekly
Technical
Technical analysis of this 1H chart of GBP/NZD indicates that the overall trend is strongly bullish. 92.86% of the signals given by moving averages are bullish. The overall trend is supported by the strong bullish signals from short-term moving averages. The Central Indicators scanner does not detect any result on moving averages that would impact this trend.
The probability of a further increase is high given the direction of the technical indicators.
But beware of excesses. The Central Indicators scanner currently detects this:
RSI indicator is overbought : over 70
Type : Neutral
Timeframe : 1 hour
CCI indicator is overbought : over 100
Type : Neutral
Timeframe : 1 hour
Williams %R indicator is overbought : over -20
Type : Neutral
Timeframe : 1 hour
Pivot points : price is over resistance 2
Type : Neutral
Timeframe : Weekly
Pivot points : price is over resistance 3
Type : Neutral
Timeframe : 1 hour
An analysis of the price chart with the Central Patterns scanner (detector of chart patterns and resistances and supports) shows several results that can have an impact on the price change:
Near horizontal resistance
Type : Bearish
Timeframe : 1 hour
Resistance of channel is broken
Type : Bullish
Timeframe : 1 hour
Central Candlesticks, the scanner specialised in Japanese candlesticks, detects a bullish signal that could support the hypothesis of a small rebound in the very short term:
Bullish engulfing lines
Type : Bullish
Timeframe : 1 hour
| S3 | S2 | S1 | Price | R1 | R2 | R3 | |
|---|---|---|---|---|---|---|---|
| ProTrendLines | 2.1058 | 2.1099 | 2.1173 | 2.1221 | 2.1362 | 2.1521 | 2.4519 |
| Change (%) | -0.77% | -0.57% | -0.23% | - | +0.66% | +1.41% | +15.54% |
| Change | -0.0163 | -0.0122 | -0.0048 | - | +0.0141 | +0.0300 | +0.3298 |
| Level | Major | Major | Intermediate | - | Minor | Major | Intermediate |
To determine price objectives, it is also possible to use the pivot points. Here is the price position in relation to pivot points:
| Pivot points | S3 | S2 | S1 | PP | R1 | R2 | R3 |
|---|---|---|---|---|---|---|---|
| Standard | 2.0887 | 2.0923 | 2.0980 | 2.1016 | 2.1073 | 2.1109 | 2.1166 |
| Camarilla | 2.1011 | 2.1020 | 2.1029 | 2.1037 | 2.1046 | 2.1054 | 2.1063 |
| Woodie | 2.0898 | 2.0928 | 2.0991 | 2.1021 | 2.1084 | 2.1114 | 2.1177 |
| Fibonacci | 2.0923 | 2.0959 | 2.0981 | 2.1016 | 2.1052 | 2.1074 | 2.1109 |
| Pivot points | S3 | S2 | S1 | PP | R1 | R2 | R3 |
|---|---|---|---|---|---|---|---|
| Standard | 2.0673 | 2.0755 | 2.0894 | 2.0976 | 2.1115 | 2.1197 | 2.1336 |
| Camarilla | 2.0972 | 2.0993 | 2.1013 | 2.1033 | 2.1053 | 2.1074 | 2.1094 |
| Woodie | 2.0702 | 2.0769 | 2.0923 | 2.0990 | 2.1144 | 2.1211 | 2.1365 |
| Fibonacci | 2.0755 | 2.0839 | 2.0892 | 2.0976 | 2.1060 | 2.1113 | 2.1197 |
| Pivot points | S3 | S2 | S1 | PP | R1 | R2 | R3 |
|---|---|---|---|---|---|---|---|
| Standard | 2.0266 | 2.0465 | 2.0777 | 2.0976 | 2.1288 | 2.1487 | 2.1799 |
| Camarilla | 2.0948 | 2.0994 | 2.1041 | 2.1088 | 2.1135 | 2.1182 | 2.1229 |
| Woodie | 2.0322 | 2.0493 | 2.0833 | 2.1004 | 2.1344 | 2.1515 | 2.1855 |
| Fibonacci | 2.0465 | 2.0661 | 2.0781 | 2.0976 | 2.1172 | 2.1292 | 2.1487 |
Numerical data
The following are the details of the technical indicators and moving averages that were collected to generate this technical analysis:
| RSI (14): | 74.88 | |
| MACD (12,26,9): | 0.0045 | |
| Directional Movement: | 25.3848 | |
| AROON (14): | 71.4286 | |
| DEMA (21): | 2.1211 | |
| Parabolic SAR (0,02-0,02-0,2): | 2.1188 | |
| Elder Ray (13): | 0.0036 | |
| Super Trend (3,10): | 2.1136 | |
| Zig ZAG (10): | 2.1221 | |
| VORTEX (21): | 1.3194 | |
| Stochastique (14,3,5): | 95.54 | |
| TEMA (21): | 2.1231 | |
| Williams %R (14): | -0.70 | |
| Chande Momentum Oscillator (20): | 0.0137 | |
| Repulse (5,40,3): | 0.1662 | |
| ROCnROLL: | 1 | |
| TRIX (15,9): | 0.0284 | |
| Courbe Coppock: | 1.04 |
| MA7: | 2.1016 | |
| MA20: | 2.1010 | |
| MA50: | 2.0908 | |
| MA100: | 2.0715 | |
| MAexp7: | 2.1201 | |
| MAexp20: | 2.1153 | |
| MAexp50: | 2.1092 | |
| MAexp100: | 2.1053 | |
| Price / MA7: | +0.98% | |
| Price / MA20: | +1.00% | |
| Price / MA50: | +1.50% | |
| Price / MA100: | +2.44% | |
| Price / MAexp7: | +0.09% | |
| Price / MAexp20: | +0.32% | |
| Price / MAexp50: | +0.61% | |
| Price / MAexp100: | +0.80% |
News
Don't forget to follow the news on GBP/NZD. At the time of publication of this analysis, the latest news was as follows:
-
 Why I'm looking to buy GBPNZD: Coleman
-
Why I'm looking to buy GBPNZD: Coleman
-
GBP/NZD: Pound Has Upperhand
-
Forex Trading Video: GBP/NZD The Cross Roads of BoE and RBNZ, Dollar Faces Wave of Data
-
Forex Strategy Video: Time Frame Matters on Entry from Themes Like Risk Trends to GBPNZD
About author
Online


Add a comment
Comments
0 comments on the analysis GBP/NZD - 1H