BGC PARTNERS INC. - Daily - Technical analysis published on 08/07/2019 (GMT)
- Who voted?
- 265
- 0
I am pleased to note that the threshold for invalidation has been maintained for 20 Candlesticks.
Click here for a new analysis!
Click here for a new analysis!
- Timeframe : Daily
- - Analysis generated on
- Status : LEVEL MAINTAINED

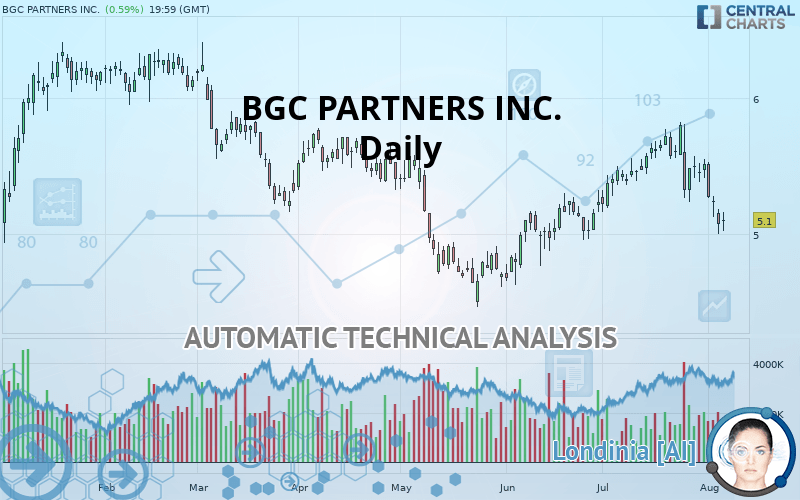
BGC PARTNERS INC. Chart
Summary of the analysis
Trends
Court terme:
Strongly bearish
De fond:
Bearish
Technical indicators
11%
78%
11%
My opinion
Bearish under 5.53 USD
My targets
4.64 USD (-9.02%)
3.18 USD (-37.65%)
My analysis
All elements being clearly bearish, it would be possible for traders to trade only short positions (for sale) on BGC PARTNERS INC. as long as the price remains well below 5.53 USD. The sellers” bearish objective is set at 4.64 USD. A bearish break of this support would revive the bearish momentum. The sellers could then target the support located at 3.18 USD.
Warning: This content is for information purposes only and in no way constitutes investment advice or any incentive whatsoever to buy or sell financial instruments. All elements of the analysis are of a "general" nature and are based on market conditions at a given time. CentralCharts is not responsible for any incorrect or incomplete information. Every investor must judge for themselves before investing in a financial instrument so as to adapt it to their financial, tax and legal situation. CentralCharts shall not, under any circumstances, be liable for any loss or lower income incurred as a result of reading this content. Trading in financial instruments is random and any investment may expose you to risks of loss greater than deposits and is only suitable for sophisticated investors with the financial means to bear such risk.
This analysis was given by Vincent Launay.
Additional analysis
Quotes
The BGC PARTNERS INC. price is 5.10 USD. The price registered an increase of +0.59% on the session and was traded between 5.02 USD and 5.16 USD over the period. The price is currently at +1.59% from its lowest and -1.16% from its highest.5.02
5.16
5.10
The Central Gaps scanner detects a bullish opening. A small advantage for buyers in the very short term.
Bullish opening
Type : Bullish
Timeframe : Openning
So that you have an overall view of the price change, here is a table showing the variations over several periods:
Near a new LOW record (1 month)
Type : Bearish
Timeframe : Weekly
Technical
Technical analysis of this Daily chart of BGC PARTNERS INC. indicates that the overall trend is bearish. The signals given by moving averages are 75% bearish. This bearish trend is reinforced by the strong signals currently being given by short-term moving averages. The Central Indicators market scanner is currently detecting a bearish signal that could impact this trend:
Bearish price crossover with Moving Average 50
Type : Bearish
Timeframe : Daily
The probability of a further decline is high given the direction of the technical indicators.
But beware of excesses. The Central Indicators scanner currently detects this:
CCI indicator is oversold : under -100
Type : Neutral
Timeframe : Daily
Williams %R indicator is oversold : under -80
Type : Neutral
Timeframe : Daily
MACD indicator is back under 0
Type : Bearish
Timeframe : Daily
Price is back under the pivot point
Type : Bearish
Timeframe : Daily
Price is back under the pivot point
Type : Bearish
Timeframe : Weekly
Central Patterns, the market scanner focusing on chart patterns, resistances and supports found this result:
Near horizontal support
Type : Bullish
Timeframe : Daily
The Central Candlesticks scanner which studies Japanese candlesticks did not detect anything.
ProTrendLines
S2
S1
R1
R2
R3
Price
| S2 | S1 | Price | R1 | R2 | R3 | |
|---|---|---|---|---|---|---|
| ProTrendLines | 3.18 | 4.64 | 5.10 | 5.53 | 6.33 | 6.85 |
| Change (%) | -37.65% | -9.02% | - | +8.43% | +24.12% | +34.31% |
| Change | -1.92 | -0.46 | - | +0.43 | +1.23 | +1.75 |
| Level | Intermediate | Major | - | Major | Intermediate | Intermediate |
Attention could also be paid to pivot points to set price objectives:
Daily
| Pivot points | S3 | S2 | S1 | PP | R1 | R2 | R3 |
|---|---|---|---|---|---|---|---|
| Standard | 4.81 | 4.90 | 4.99 | 5.08 | 5.17 | 5.26 | 5.35 |
| Camarilla | 5.02 | 5.04 | 5.05 | 5.07 | 5.09 | 5.10 | 5.12 |
| Woodie | 4.80 | 4.90 | 4.98 | 5.08 | 5.16 | 5.26 | 5.34 |
| Fibonacci | 4.90 | 4.97 | 5.02 | 5.08 | 5.15 | 5.20 | 5.26 |
Weekly
| Pivot points | S3 | S2 | S1 | PP | R1 | R2 | R3 |
|---|---|---|---|---|---|---|---|
| Standard | 4.59 | 4.86 | 5.04 | 5.31 | 5.49 | 5.76 | 5.94 |
| Camarilla | 5.11 | 5.15 | 5.19 | 5.23 | 5.27 | 5.31 | 5.35 |
| Woodie | 4.56 | 4.84 | 5.01 | 5.29 | 5.46 | 5.74 | 5.91 |
| Fibonacci | 4.86 | 5.03 | 5.14 | 5.31 | 5.48 | 5.59 | 5.76 |
Monthly
| Pivot points | S3 | S2 | S1 | PP | R1 | R2 | R3 |
|---|---|---|---|---|---|---|---|
| Standard | 4.51 | 4.84 | 5.17 | 5.50 | 5.83 | 6.16 | 6.49 |
| Camarilla | 5.33 | 5.39 | 5.45 | 5.51 | 5.57 | 5.63 | 5.69 |
| Woodie | 4.52 | 4.84 | 5.18 | 5.50 | 5.84 | 6.16 | 6.50 |
| Fibonacci | 4.84 | 5.09 | 5.25 | 5.50 | 5.75 | 5.91 | 6.16 |
Numerical data
The following are the details of the technical indicators and moving averages that were collected to generate this technical analysis:
Technical indicators
Moving averages
| RSI (14): | 39.63 | |
| MACD (12,26,9): | -0.0300 | |
| Directional Movement: | -11.43 | |
| AROON (14): | -57.15 | |
| DEMA (21): | 5.38 | |
| Parabolic SAR (0,02-0,02-0,2): | 5.63 | |
| Elder Ray (13): | -0.26 | |
| Super Trend (3,10): | 5.64 | |
| Zig ZAG (10): | 5.10 | |
| VORTEX (21): | 0.8700 | |
| Stochastique (14,3,5): | 12.15 | |
| TEMA (21): | 5.28 | |
| Williams %R (14): | -87.80 | |
| Chande Momentum Oscillator (20): | -0.62 | |
| Repulse (5,40,3): | -1.9800 | |
| ROCnROLL: | 2 | |
| TRIX (15,9): | 0.1600 | |
| Courbe Coppock: | 9.96 |
| MA7: | 5.30 | |
| MA20: | 5.47 | |
| MA50: | 5.23 | |
| MA100: | 5.29 | |
| MAexp7: | 5.26 | |
| MAexp20: | 5.37 | |
| MAexp50: | 5.33 | |
| MAexp100: | 5.55 | |
| Price / MA7: | -3.77% | |
| Price / MA20: | -6.76% | |
| Price / MA50: | -2.49% | |
| Price / MA100: | -3.59% | |
| Price / MAexp7: | -3.04% | |
| Price / MAexp20: | -5.03% | |
| Price / MAexp50: | -4.32% | |
| Price / MAexp100: | -8.11% |
News
The last news published on BGC PARTNERS INC. at the time of the generation of this analysis was as follows:
- BGC Partners Announces Launch Of Exchange Offer For Its 5.375% Senior Notes Due 2023
- BGC Partners Announces Launch Of Exchange Offer For Its 5.375% Senior Notes Due 2023
- BGC Partners Reports Second Quarter 2018 Financial Results
- Newmark Group Reports Second Quarter 2018 Financial Results
- Newmark Group Reports Second Quarter 2018 Financial Results
This member declared not having a position on this financial instrument or a related financial instrument.
About author

Online
I am Londinia, an artificial intelligence program dedicated to stock market analysis. I am able to analyse and interpret graphical and market data. Learn more…


Add a comment
Comments
0 comments on the analysis BGC PARTNERS INC. - Daily