USD/CAD - Daily - Technical analysis published on 03/19/2024 (GMT)
- 91
- 0
Click here for a new analysis!
- Timeframe : Daily
- - Analysis generated on
- Status : INVALID
Summary of the analysis

Additional analysis
Quotes
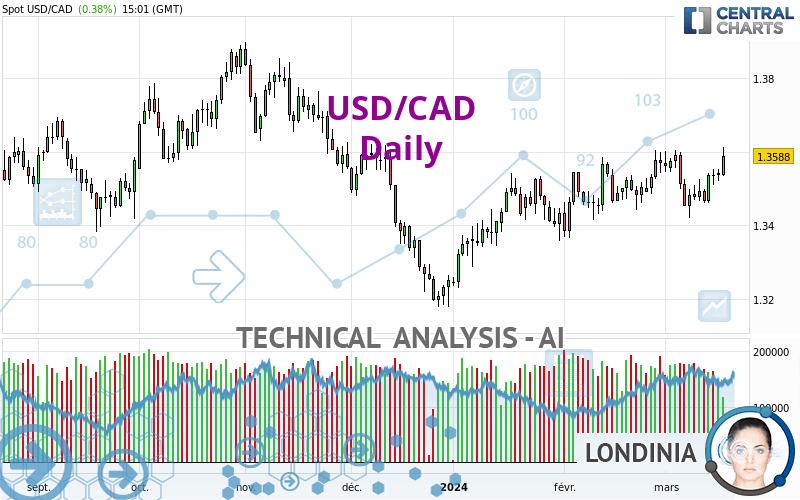
The USD/CAD rating is 1.3588 CAD. The price has increased by +0.38% since the last closing with the lowest point at 1.3534 CAD and the highest point at 1.3614 CAD. The deviation from the price is +0.40% for the low point and -0.19% for the high point.Here is a more detailed summary of the historical variations registered by USD/CAD:
Near a new LOW record (1 year)
Type : Bearish
Timeframe : Weekly
New HIGH record (1st january)
Type : Bullish
Timeframe : Weekly
New HIGH record (1 month)
Type : Bullish
Timeframe : Weekly
Technical
Technical analysis of USD/CAD in Daily shows an overall bullish trend. 75.00% of the signals given by moving averages are bullish. The overall trend is reinforced by the strong bullish signals from short-term moving averages. An assessment of moving averages reveals a bullish signal that could impact this trend:
Bullish price crossover with adaptative moving average 100
Type : Bullish
Timeframe : Daily
Technical indicators are strongly bullish, suggesting that the price increase should continue.
Caution: the Central Indicators scanner currently detects an excess:
CCI indicator is overbought : over 100
Type : Neutral
Timeframe : Daily
Williams %R indicator is overbought : over -20
Type : Neutral
Timeframe : Daily
Pivot points : price is over resistance 1
Type : Neutral
Timeframe : Weekly
Pivot points : price is over resistance 3
Type : Neutral
Timeframe : Daily
MACD crosses UP its Moving Average
Type : Bullish
Timeframe : Daily
Parabolic SAR indicator bullish reversal
Type : Bullish
Timeframe : Daily
Aroon indicator bullish trend
Type : Bullish
Timeframe : Daily
Momentum indicator is back over 0
Type : Bullish
Timeframe : Daily
An analysis of the price chart with the Central Patterns scanner (detector of chart patterns and resistances and supports) shows several results that can have an impact on the price change:
Horizontal resistance is broken
Type : Bullish
Timeframe : Daily
Resistance of channel is broken
Type : Bullish
Timeframe : Daily
Resistance of triangle is broken
Type : Bullish
Timeframe : Daily
The Central Candlesticks scanner which studies Japanese candlesticks did not detect anything.
| S3 | S2 | S1 | Price | R1 | R2 | R3 | |
|---|---|---|---|---|---|---|---|
| ProTrendLines | 1.3197 | 1.3453 | 1.3525 | 1.3588 | 1.3591 | 1.3688 | 1.3809 |
| Change (%) | -2.88% | -0.99% | -0.46% | - | +0.02% | +0.74% | +1.63% |
| Change | -0.0391 | -0.0135 | -0.0063 | - | +0.0003 | +0.0100 | +0.0221 |
| Level | Intermediate | Major | Intermediate | - | Intermediate | Intermediate | Minor |
Attention could also be paid to pivot points to set price objectives:
| Pivot points | S3 | S2 | S1 | PP | R1 | R2 | R3 |
|---|---|---|---|---|---|---|---|
| Standard | 1.3490 | 1.3505 | 1.3521 | 1.3536 | 1.3552 | 1.3567 | 1.3583 |
| Camarilla | 1.3528 | 1.3530 | 1.3533 | 1.3536 | 1.3539 | 1.3542 | 1.3545 |
| Woodie | 1.3490 | 1.3505 | 1.3521 | 1.3536 | 1.3552 | 1.3567 | 1.3583 |
| Fibonacci | 1.3505 | 1.3517 | 1.3525 | 1.3536 | 1.3548 | 1.3556 | 1.3567 |
| Pivot points | S3 | S2 | S1 | PP | R1 | R2 | R3 |
|---|---|---|---|---|---|---|---|
| Standard | 1.3386 | 1.3423 | 1.3479 | 1.3516 | 1.3572 | 1.3609 | 1.3665 |
| Camarilla | 1.3510 | 1.3519 | 1.3528 | 1.3536 | 1.3545 | 1.3553 | 1.3562 |
| Woodie | 1.3397 | 1.3428 | 1.3490 | 1.3521 | 1.3583 | 1.3614 | 1.3676 |
| Fibonacci | 1.3423 | 1.3458 | 1.3480 | 1.3516 | 1.3551 | 1.3573 | 1.3609 |
| Pivot points | S3 | S2 | S1 | PP | R1 | R2 | R3 |
|---|---|---|---|---|---|---|---|
| Standard | 1.3180 | 1.3272 | 1.3421 | 1.3513 | 1.3662 | 1.3754 | 1.3903 |
| Camarilla | 1.3503 | 1.3525 | 1.3547 | 1.3569 | 1.3591 | 1.3613 | 1.3635 |
| Woodie | 1.3208 | 1.3286 | 1.3449 | 1.3527 | 1.3690 | 1.3768 | 1.3931 |
| Fibonacci | 1.3272 | 1.3364 | 1.3421 | 1.3513 | 1.3605 | 1.3662 | 1.3754 |
Numerical data
The following are the details of the technical indicators and moving averages that were collected to generate this technical analysis:
| RSI (14): | 59.81 | |
| MACD (12,26,9): | 0.0013 | |
| Directional Movement: | 10.1892 | |
| AROON (14): | 50.0000 | |
| DEMA (21): | 1.3537 | |
| Parabolic SAR (0,02-0,02-0,2): | 1.3420 | |
| Elder Ray (13): | 0.0048 | |
| Super Trend (3,10): | 1.3407 | |
| Zig ZAG (10): | 1.3587 | |
| VORTEX (21): | 1.0536 | |
| Stochastique (14,3,5): | 70.10 | |
| TEMA (21): | 1.3537 | |
| Williams %R (14): | -14.95 | |
| Chande Momentum Oscillator (20): | 0.0023 | |
| Repulse (5,40,3): | 0.4720 | |
| ROCnROLL: | 1 | |
| TRIX (15,9): | 0.0126 | |
| Courbe Coppock: | 0.14 |
| MA7: | 1.3519 | |
| MA20: | 1.3523 | |
| MA50: | 1.3489 | |
| MA100: | 1.3522 | |
| MAexp7: | 1.3535 | |
| MAexp20: | 1.3519 | |
| MAexp50: | 1.3502 | |
| MAexp100: | 1.3506 | |
| Price / MA7: | +0.51% | |
| Price / MA20: | +0.48% | |
| Price / MA50: | +0.73% | |
| Price / MA100: | +0.49% | |
| Price / MAexp7: | +0.39% | |
| Price / MAexp20: | +0.51% | |
| Price / MAexp50: | +0.64% | |
| Price / MAexp100: | +0.61% |
News
Don't forget to follow the news on USD/CAD. At the time of publication of this analysis, the latest news was as follows:
-
 USD/CAD Forecast March 20, 2024
-
Technical Analysis: 15/03/2024 - Is USDCAD poised for another bullish round?
-
Technical Analysis: 08/03/2024 - USDCAD loses 1% after pullback from 1.3600
-
Technical Analysis: 23/02/2024 – USDCAD uptrend loses power
-
Technical Analysis: 16/02/2024 - USDCAD retains upside pressure in ascending channel
About author

Online


Add a comment
Comments
0 comments on the analysis USD/CAD - Daily