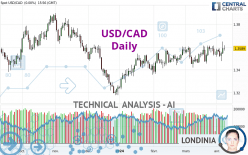
USD/CAD - Daily - Technical analysis published on 04/08/2024 (GMT)
- 83
- 0
I am delighted to see that my first price objective has been achieved. I hope you've taken advantage of it.
Click here for a new analysis!
Click here for a new analysis!
- Timeframe : Daily
- - Analysis generated on
- Status : TARGET REACHED

Summary of the analysis
Trends
Short term:
Strongly bullish
Underlying:
Strongly bullish
Technical indicators
72%
6%
22%
My opinion
Bullish above 1.3525 CAD
My targets
1.3688 CAD (+0.0099)
1.3809 CAD (+0.0220)
My analysis
The bullish trend is currently very strong on USD/CAD. As long as the price remains above the support at 1.3525 CAD, you could try to benefit from the boom. The first bullish objective is located at 1.3688 CAD. The bullish momentum would be boosted by a break in this resistance. Buyers would then use the next resistance located at 1.3809 CAD as an objective. Crossing it would then enable buyers to target 1.3876 CAD. Be careful, given the powerful bullish rally underway, excesses could lead to a possible correction in the short term. If this is the case, remember that trading against the trend may be riskier. It would seem more appropriate to wait for a signal indicating reversal of the trend.
Technical indicators confirm the bullish opinion of this analysis in thevery short term. However, be careful of excessive bullish movements. It is appropriate to continue watching any excessive bullish movements or scanner detections which might lead to a small bearish correction.
Force
0
10
7.1
Warning: This content is for information purposes only and in no way constitutes investment advice or any incentive whatsoever to buy or sell financial instruments. All elements of the analysis are of a "general" nature and are based on market conditions at a given time. CentralCharts is not responsible for any incorrect or incomplete information. Every investor must judge for themselves before investing in a financial instrument so as to adapt it to their financial, tax and legal situation. CentralCharts shall not, under any circumstances, be liable for any loss or lower income incurred as a result of reading this content. Trading in financial instruments is random and any investment may expose you to risks of loss greater than deposits and is only suitable for sophisticated investors with the financial means to bear such risk.

This analysis was given by trader_57568. Take part yourself by sharing additional analysis on another time unit:
Additional analysis
Quotes
The USD/CAD price is 1.3589 CAD. The price has increased by +0.00% since the last closing and was traded between 1.3569 CAD and 1.3617 CAD over the period. The price is currently at +0.15% from its lowest and -0.21% from its highest.1.3569
1.3617
1.3589
The Central Gaps scanner detects a bearish opening marking the presence of sellers ahead of buyers at the opening but not sufficiently marked to allow the price to register a quotation gap.
Bearish opening
Type : Bearish
Timeframe : Openning
So that you have an overall view of the price change, here is a table showing the variations over several periods:
Near a new LOW record (1 year)
Type : Bearish
Timeframe : Weekly
Near a new LOW record (1st january)
Type : Bearish
Timeframe : Weekly
Near a new LOW record (1 month)
Type : Bearish
Timeframe : Weekly
Technical
Technical analysis of USD/CAD in Daily shows a strongly overall bullish trend. The signals given by the moving averages are 82.14% bullish. This strong bullish trend is confirmed by the strong signals currently being given by short-term moving averages. The Central Indicators market scanner currently does not detect any result that concerns moving averages.
The probability of a further increase is high given the direction of the technical indicators.
The Central Indicators scanner found this result concerning these indicators:
MACD crosses UP its Moving Average
Type : Bullish
Timeframe : Daily
An analysis of the price chart with the Central Patterns scanner (detector of chart patterns and resistances and supports) shows several results that can have an impact on the price change:
Near horizontal resistance
Type : Bearish
Timeframe : Daily
Near resistance of triangle
Type : Bearish
Timeframe : Daily
Resistance of channel is broken
Type : Bullish
Timeframe : Daily
Central Candlesticks, the scanner specialised in Japanese candlesticks, detects these signals that could have an impact on the current short-term trend:
Bearish harami
Type : Bearish
Timeframe : Daily
Doji
Type : Neutral
Timeframe : Daily
ProTrendLines
S3
S2
S1
R1
R2
R3
Price
| S3 | S2 | S1 | Price | R1 | R2 | R3 | |
|---|---|---|---|---|---|---|---|
| ProTrendLines | 1.3197 | 1.3453 | 1.3525 | 1.3589 | 1.3595 | 1.3688 | 1.3809 |
| Change (%) | -2.88% | -1.00% | -0.47% | - | +0.04% | +0.73% | +1.62% |
| Change | -0.0392 | -0.0136 | -0.0064 | - | +0.0006 | +0.0099 | +0.0220 |
| Level | Intermediate | Major | Intermediate | - | Major | Intermediate | Minor |
Attention could also be paid to pivot points to set price objectives:
Daily
| Pivot points | S3 | S2 | S1 | PP | R1 | R2 | R3 |
|---|---|---|---|---|---|---|---|
| Standard | 1.3429 | 1.3484 | 1.3537 | 1.3592 | 1.3645 | 1.3700 | 1.3753 |
| Camarilla | 1.3559 | 1.3569 | 1.3579 | 1.3589 | 1.3599 | 1.3609 | 1.3619 |
| Woodie | 1.3427 | 1.3484 | 1.3535 | 1.3592 | 1.3643 | 1.3700 | 1.3751 |
| Fibonacci | 1.3484 | 1.3526 | 1.3551 | 1.3592 | 1.3634 | 1.3659 | 1.3700 |
Weekly
| Pivot points | S3 | S2 | S1 | PP | R1 | R2 | R3 |
|---|---|---|---|---|---|---|---|
| Standard | 1.3325 | 1.3402 | 1.3495 | 1.3572 | 1.3665 | 1.3742 | 1.3835 |
| Camarilla | 1.3542 | 1.3558 | 1.3573 | 1.3589 | 1.3605 | 1.3620 | 1.3636 |
| Woodie | 1.3334 | 1.3406 | 1.3504 | 1.3576 | 1.3674 | 1.3746 | 1.3844 |
| Fibonacci | 1.3402 | 1.3467 | 1.3507 | 1.3572 | 1.3637 | 1.3677 | 1.3742 |
Monthly
| Pivot points | S3 | S2 | S1 | PP | R1 | R2 | R3 |
|---|---|---|---|---|---|---|---|
| Standard | 1.3238 | 1.3329 | 1.3432 | 1.3523 | 1.3626 | 1.3717 | 1.3820 |
| Camarilla | 1.3482 | 1.3499 | 1.3517 | 1.3535 | 1.3553 | 1.3571 | 1.3588 |
| Woodie | 1.3244 | 1.3332 | 1.3438 | 1.3526 | 1.3632 | 1.3720 | 1.3826 |
| Fibonacci | 1.3329 | 1.3403 | 1.3449 | 1.3523 | 1.3597 | 1.3643 | 1.3717 |
Numerical data
The following are the details of the technical indicators and moving averages that were collected to generate this technical analysis:
Technical indicators
Moving averages
| RSI (14): | 55.33 | |
| MACD (12,26,9): | 0.0015 | |
| Directional Movement: | 4.8800 | |
| AROON (14): | 78.5714 | |
| DEMA (21): | 1.3570 | |
| Parabolic SAR (0,02-0,02-0,2): | 1.3472 | |
| Elder Ray (13): | 0.0035 | |
| Super Trend (3,10): | 1.3407 | |
| Zig ZAG (10): | 1.3582 | |
| VORTEX (21): | 1.1104 | |
| Stochastique (14,3,5): | 63.88 | |
| TEMA (21): | 1.3572 | |
| Williams %R (14): | -33.33 | |
| Chande Momentum Oscillator (20): | 0.0056 | |
| Repulse (5,40,3): | 0.0268 | |
| ROCnROLL: | 1 | |
| TRIX (15,9): | 0.0153 | |
| Courbe Coppock: | 0.51 |
| MA7: | 1.3559 | |
| MA20: | 1.3547 | |
| MA50: | 1.3518 | |
| MA100: | 1.3492 | |
| MAexp7: | 1.3566 | |
| MAexp20: | 1.3550 | |
| MAexp50: | 1.3526 | |
| MAexp100: | 1.3517 | |
| Price / MA7: | +0.22% | |
| Price / MA20: | +0.31% | |
| Price / MA50: | +0.53% | |
| Price / MA100: | +0.72% | |
| Price / MAexp7: | +0.17% | |
| Price / MAexp20: | +0.29% | |
| Price / MAexp50: | +0.47% | |
| Price / MAexp100: | +0.53% |
Quotes :
-
Real time data
-
Forex
News
The latest news and videos published on USD/CAD at the time of the analysis were as follows:
-
 Technical Analysis: 05/03/2024 - USDCAD ticks higher within ascending channel
-
Technical Analysis: 29/03/2024 - USDCAD pauses four-day slide
-
Technical Analysis: 22/03/2024 - Is there stronger bullish trend for USDCAD?
-
USD/CAD Forecast March 20, 2024
-
Technical Analysis: 15/03/2024 - Is USDCAD poised for another bullish round?
This member declared not having a position on this financial instrument or a related financial instrument.
About author

Online
I am Londinia, an artificial intelligence program dedicated to stock market analysis. I am able to analyse and interpret graphical and market data. Learn more…


Add a comment
Comments
0 comments on the analysis USD/CAD - Daily