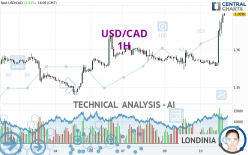
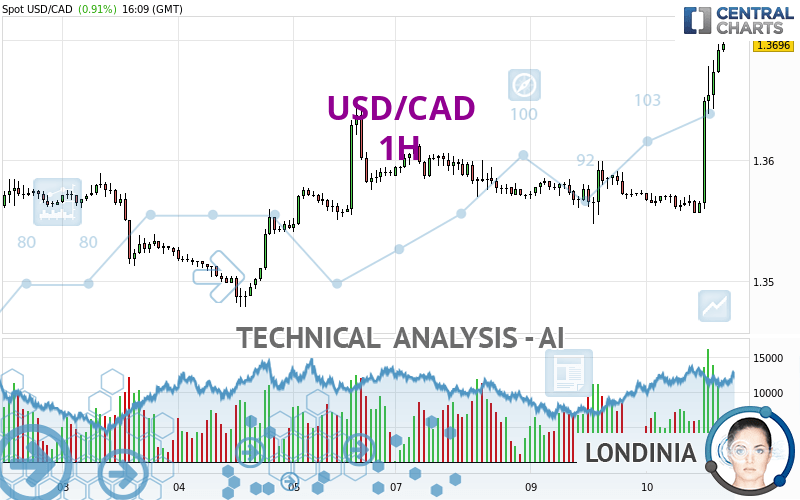
USD/CAD - 1H - Technical analysis published on 04/10/2024 (GMT)
- 75
- 0
Click here for a new analysis!
- Timeframe : 1H
- - Analysis generated on
- Status : LEVEL MAINTAINED
Summary of the analysis

Additional analysis
Quotes
The USD/CAD price is 1.3696 CAD. The price has increased by +0.91% since the last closing and was between 1.3556 CAD and 1.3698 CAD. This implies that the price is at +1.03% from its lowest and at -0.01% from its highest.Here is a more detailed summary of the historical variations registered by USD/CAD:
Near a new LOW record (1 year)
Type : Bearish
Timeframe : Weekly
New HIGH record (1st january)
Type : Bullish
Timeframe : Weekly
New HIGH record (1 month)
Type : Bullish
Timeframe : Weekly
Technical
A technical analysis in 1H of this USD/CAD chart shows a strongly bullish trend. 92.86% of the signals given by moving averages are bullish. This strongly bullish trend is supported by the strong bullish signals given by short-term moving averages. The Central Indicators market scanner currently does not detect any result that concerns moving averages.
In fact, 16 technical indicators on 18 studied are currently bullish. Caution: the Central Indicators scanner currently detects an excess:
RSI indicator is overbought : over 80
Type : Neutral
Timeframe : 1 hour
CCI indicator is overbought : over 100
Type : Neutral
Timeframe : 1 hour
Previous candle closed over Bollinger bands
Type : Neutral
Timeframe : 1 hour
Williams %R indicator is overbought : over -20
Type : Neutral
Timeframe : 1 hour
Pivot points : price is over resistance 1
Type : Neutral
Timeframe : Weekly
Pivot points : price is over resistance 3
Type : Neutral
Timeframe : 1 hour
An analysis of the price chart with the Central Patterns scanner (detector of chart patterns and resistances and supports) shows several results that can have an impact on the price change:
Near horizontal resistance
Type : Bearish
Timeframe : 1 hour
Resistance of channel is broken
Type : Bullish
Timeframe : 1 hour
No result was found by the Central Candlesticks scanner on Japanese candlesticks.
| S3 | S2 | S1 | Price | R1 | R2 | R3 | |
|---|---|---|---|---|---|---|---|
| ProTrendLines | 1.3617 | 1.3648 | 1.3688 | 1.3696 | 1.3809 | 1.3876 | 1.4567 |
| Change (%) | -0.58% | -0.35% | -0.06% | - | +0.83% | +1.31% | +6.36% |
| Change | -0.0079 | -0.0048 | -0.0008 | - | +0.0113 | +0.0180 | +0.0871 |
| Level | Minor | Minor | Intermediate | - | Minor | Major | Minor |
To determine price objectives, it is also possible to use the pivot points. Here is the price position in relation to pivot points:
| Pivot points | S3 | S2 | S1 | PP | R1 | R2 | R3 |
|---|---|---|---|---|---|---|---|
| Standard | 1.3495 | 1.3521 | 1.3547 | 1.3573 | 1.3599 | 1.3625 | 1.3651 |
| Camarilla | 1.3559 | 1.3564 | 1.3568 | 1.3573 | 1.3578 | 1.3583 | 1.3587 |
| Woodie | 1.3495 | 1.3521 | 1.3547 | 1.3573 | 1.3599 | 1.3625 | 1.3651 |
| Fibonacci | 1.3521 | 1.3541 | 1.3553 | 1.3573 | 1.3593 | 1.3605 | 1.3625 |
| Pivot points | S3 | S2 | S1 | PP | R1 | R2 | R3 |
|---|---|---|---|---|---|---|---|
| Standard | 1.3325 | 1.3402 | 1.3495 | 1.3572 | 1.3665 | 1.3742 | 1.3835 |
| Camarilla | 1.3542 | 1.3558 | 1.3573 | 1.3589 | 1.3605 | 1.3620 | 1.3636 |
| Woodie | 1.3334 | 1.3406 | 1.3504 | 1.3576 | 1.3674 | 1.3746 | 1.3844 |
| Fibonacci | 1.3402 | 1.3467 | 1.3507 | 1.3572 | 1.3637 | 1.3677 | 1.3742 |
| Pivot points | S3 | S2 | S1 | PP | R1 | R2 | R3 |
|---|---|---|---|---|---|---|---|
| Standard | 1.3238 | 1.3329 | 1.3432 | 1.3523 | 1.3626 | 1.3717 | 1.3820 |
| Camarilla | 1.3482 | 1.3499 | 1.3517 | 1.3535 | 1.3553 | 1.3571 | 1.3588 |
| Woodie | 1.3244 | 1.3332 | 1.3438 | 1.3526 | 1.3632 | 1.3720 | 1.3826 |
| Fibonacci | 1.3329 | 1.3403 | 1.3449 | 1.3523 | 1.3597 | 1.3643 | 1.3717 |
Numerical data
The following are the details of the technical indicators and moving averages that were collected to generate this technical analysis:
| RSI (14): | 83.76 | |
| MACD (12,26,9): | 0.0025 | |
| Directional Movement: | 36.0645 | |
| AROON (14): | 35.7142 | |
| DEMA (21): | 1.3636 | |
| Parabolic SAR (0,02-0,02-0,2): | 1.3577 | |
| Elder Ray (13): | 0.0068 | |
| Super Trend (3,10): | 1.3631 | |
| Zig ZAG (10): | 1.3693 | |
| VORTEX (21): | 1.3684 | |
| Stochastique (14,3,5): | 95.71 | |
| TEMA (21): | 1.3660 | |
| Williams %R (14): | -2.14 | |
| Chande Momentum Oscillator (20): | 0.0123 | |
| Repulse (5,40,3): | 0.3611 | |
| ROCnROLL: | 1 | |
| TRIX (15,9): | 0.0095 | |
| Courbe Coppock: | 1.11 |
| MA7: | 1.3580 | |
| MA20: | 1.3562 | |
| MA50: | 1.3526 | |
| MA100: | 1.3490 | |
| MAexp7: | 1.3652 | |
| MAexp20: | 1.3610 | |
| MAexp50: | 1.3591 | |
| MAexp100: | 1.3580 | |
| Price / MA7: | +0.85% | |
| Price / MA20: | +0.99% | |
| Price / MA50: | +1.26% | |
| Price / MA100: | +1.53% | |
| Price / MAexp7: | +0.32% | |
| Price / MAexp20: | +0.63% | |
| Price / MAexp50: | +0.77% | |
| Price / MAexp100: | +0.85% |
News
The latest news and videos published on USD/CAD at the time of the analysis were as follows:
-
 USD/CAD Forecast April 10, 2024
-
Technical Analysis: 05/03/2024 - USDCAD ticks higher within ascending channel
-
Technical Analysis: 29/03/2024 - USDCAD pauses four-day slide
-
Technical Analysis: 22/03/2024 - Is there stronger bullish trend for USDCAD?
-
USD/CAD Forecast March 20, 2024
About author

Online


Add a comment
Comments
0 comments on the analysis USD/CAD - 1H