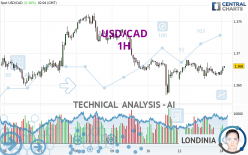
USD/CAD - 1H - Technical analysis published on 05/14/2024 (GMT)
- 92
- 0
Click here for a new analysis!
- Timeframe : 1H
- - Analysis generated on
- Status : TARGET REACHED

Summary of the analysis

Additional analysis
Quotes
USD/CAD rating 1.3680 CAD. The price has increased by +0.10% since the last closing with the lowest point at 1.3666 CAD and the highest point at 1.3680 CAD. The deviation from the price is +0.10% for the low point and 0% for the high point.A study of price movements over other periods shows the following variations:
Near a new LOW record (1 year)
Type : Bearish
Timeframe : Weekly
Near a new LOW record (1st january)
Type : Bearish
Timeframe : Weekly
Near a new HIGH record (1 month)
Type : Bullish
Timeframe : Weekly
Technical
Technical analysis of this 1H chart of USD/CAD indicates that the overall trend is bearish. The signals given by moving averages are at 67.86% bearish. This bearish trend could slow down given the slightly bullish signals currently being given by short-term moving averages. The Central Indicators market scanner is currently detecting several bullish signals that could impact this trend:
Bullish price crossover with Moving Average 20
Type : Bullish
Timeframe : 1 hour
Bullish price crossover with Moving Average 50
Type : Bullish
Timeframe : 1 hour
Bullish price crossover with adaptative moving average 20
Type : Bullish
Timeframe : 1 hour
Bullish price crossover with adaptative moving average 50
Type : Bullish
Timeframe : 1 hour
Technical indicators are slightly bullish. There is therefore considerable uncertainty about the continuation of the increase.
Central Indicators, the detector scanner for these technical indicators has recently detected several signals:
RSI indicator is back over 50
Type : Bullish
Timeframe : 1 hour
MACD crosses UP its Moving Average
Type : Bullish
Timeframe : 1 hour
Price is back over the pivot point
Type : Bullish
Timeframe : 1 hour
Momentum indicator is back over 0
Type : Bullish
Timeframe : 1 hour
Williams %R indicator is back over -50
Type : Bullish
Timeframe : 1 hour
An analysis of the price chart with the Central Patterns scanner (detector of chart patterns and resistances and supports) shows several results that can have an impact on the price change:
Near horizontal resistance
Type : Bearish
Timeframe : 1 hour
Resistance of channel is broken
Type : Bullish
Timeframe : 1 hour
The Central Candlesticks scanner, specialised in Japanese candlesticks, did not identify any signals.
| S3 | S2 | S1 | Price | R1 | R2 | R3 | |
|---|---|---|---|---|---|---|---|
| ProTrendLines | 1.3634 | 1.3648 | 1.3660 | 1.3680 | 1.3686 | 1.3715 | 1.3738 |
| Change (%) | -0.34% | -0.23% | -0.15% | - | +0.04% | +0.26% | +0.42% |
| Change | -0.0046 | -0.0032 | -0.0020 | - | +0.0006 | +0.0035 | +0.0058 |
| Level | Minor | Minor | Intermediate | - | Major | Minor | Minor |
Attention could also be paid to pivot points to set price objectives:
| Pivot points | S3 | S2 | S1 | PP | R1 | R2 | R3 |
|---|---|---|---|---|---|---|---|
| Standard | 1.3621 | 1.3639 | 1.3653 | 1.3671 | 1.3685 | 1.3703 | 1.3717 |
| Camarilla | 1.3657 | 1.3660 | 1.3663 | 1.3666 | 1.3669 | 1.3672 | 1.3675 |
| Woodie | 1.3618 | 1.3638 | 1.3650 | 1.3670 | 1.3682 | 1.3702 | 1.3714 |
| Fibonacci | 1.3639 | 1.3652 | 1.3659 | 1.3671 | 1.3684 | 1.3691 | 1.3703 |
| Pivot points | S3 | S2 | S1 | PP | R1 | R2 | R3 |
|---|---|---|---|---|---|---|---|
| Standard | 1.3487 | 1.3561 | 1.3616 | 1.3690 | 1.3745 | 1.3819 | 1.3874 |
| Camarilla | 1.3637 | 1.3648 | 1.3660 | 1.3672 | 1.3684 | 1.3696 | 1.3708 |
| Woodie | 1.3479 | 1.3556 | 1.3608 | 1.3685 | 1.3737 | 1.3814 | 1.3866 |
| Fibonacci | 1.3561 | 1.3610 | 1.3640 | 1.3690 | 1.3739 | 1.3769 | 1.3819 |
| Pivot points | S3 | S2 | S1 | PP | R1 | R2 | R3 |
|---|---|---|---|---|---|---|---|
| Standard | 1.3187 | 1.3333 | 1.3555 | 1.3701 | 1.3923 | 1.4069 | 1.4291 |
| Camarilla | 1.3677 | 1.3711 | 1.3744 | 1.3778 | 1.3812 | 1.3846 | 1.3879 |
| Woodie | 1.3226 | 1.3352 | 1.3594 | 1.3720 | 1.3962 | 1.4088 | 1.4330 |
| Fibonacci | 1.3333 | 1.3473 | 1.3560 | 1.3701 | 1.3841 | 1.3928 | 1.4069 |
Numerical data
The following is the status of technical indicators and moving averages registered at the time this technical analysis was created:
| RSI (14): | 53.50 | |
| MACD (12,26,9): | -0.0002 | |
| Directional Movement: | 3.6965 | |
| AROON (14): | 14.2857 | |
| DEMA (21): | 1.3670 | |
| Parabolic SAR (0,02-0,02-0,2): | 1.3688 | |
| Elder Ray (13): | 0.0002 | |
| Super Trend (3,10): | 1.3657 | |
| Zig ZAG (10): | 1.3676 | |
| VORTEX (21): | 0.9371 | |
| Stochastique (14,3,5): | 45.33 | |
| TEMA (21): | 1.3671 | |
| Williams %R (14): | -36.00 | |
| Chande Momentum Oscillator (20): | 0.0012 | |
| Repulse (5,40,3): | 0.0598 | |
| ROCnROLL: | -1 | |
| TRIX (15,9): | -0.0020 | |
| Courbe Coppock: | 0.07 |
| MA7: | 1.3689 | |
| MA20: | 1.3702 | |
| MA50: | 1.3624 | |
| MA100: | 1.3536 | |
| MAexp7: | 1.3671 | |
| MAexp20: | 1.3672 | |
| MAexp50: | 1.3678 | |
| MAexp100: | 1.3687 | |
| Price / MA7: | -0.07% | |
| Price / MA20: | -0.16% | |
| Price / MA50: | +0.41% | |
| Price / MA100: | +1.06% | |
| Price / MAexp7: | +0.07% | |
| Price / MAexp20: | +0.06% | |
| Price / MAexp50: | +0.01% | |
| Price / MAexp100: | -0.05% |
News
The last news published on USD/CAD at the time of the generation of this analysis was as follows:
-
 Trade of the Week: Time to go long USDCAD?
-
USD/CAD Forecast May 8, 2024
-
USD/CAD Forecast May 2, 2024
-
USD/CAD Forecast April 10, 2024
-
Technical Analysis: 05/03/2024 - USDCAD ticks higher within ascending channel
About author

Online


Add a comment
Comments
0 comments on the analysis USD/CAD - 1H