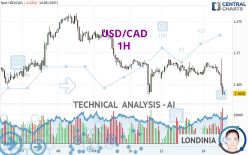
USD/CAD - 1H - Technical analysis published on 05/14/2024 (GMT)
- 59
- 0
Click here for a new analysis!
- Timeframe : 1H
- - Analysis generated on
- Status : INVALID

Summary of the analysis

Additional analysis
Quotes
The USD/CAD rating is 1.3636 CAD. The price is lower by -0.22% since the last closing and was traded between 1.3633 CAD and 1.3691 CAD over the period. The price is currently at +0.02% from its lowest and -0.40% from its highest.So that you have an overall view of the price change, here is a table showing the variations over several periods:
Near a new LOW record (1 year)
Type : Bearish
Timeframe : Weekly
Near a new LOW record (1st january)
Type : Bearish
Timeframe : Weekly
Near a new HIGH record (1 month)
Type : Bullish
Timeframe : Weekly
Technical
Technical analysis of USD/CAD in 1H shows a overall strongly bearish trend. The signals given by moving averages are 92.86% bearish. This strong bearish trend is confirmed by the strong signals currently being given by short-term moving averages. The Central Indicators scanner does not detect any result on moving averages that would impact this trend.
An assessment of technical indicators shows a bearish signal.
Caution: the Central Indicators scanner currently detects an excess:
RSI indicator is oversold : under 30
Type : Neutral
Timeframe : 1 hour
CCI indicator is oversold : under -100
Type : Neutral
Timeframe : 1 hour
Previous candle closed under Bollinger bands
Type : Neutral
Timeframe : 1 hour
Williams %R indicator is oversold : under -80
Type : Neutral
Timeframe : 1 hour
Pivot points : price is under support 3
Type : Neutral
Timeframe : 1 hour
An analysis of the price chart with the Central Patterns scanner (detector of chart patterns and resistances and supports) shows several results that can have an impact on the price change:
Near horizontal support
Type : Bullish
Timeframe : 1 hour
Support of channel is broken
Type : Bearish
Timeframe : 1 hour
Central Candlesticks, the scanner specialised in Japanese candlesticks, detects a bullish signal that could support the hypothesis of a small rebound in the very short term:
Bullish harami
Type : Bullish
Timeframe : 1 hour
| S3 | S2 | S1 | Price | R1 | R2 | R3 | |
|---|---|---|---|---|---|---|---|
| ProTrendLines | 1.3525 | 1.3609 | 1.3634 | 1.3636 | 1.3648 | 1.3660 | 1.3686 |
| Change (%) | -0.81% | -0.20% | -0.01% | - | +0.09% | +0.18% | +0.37% |
| Change | -0.0111 | -0.0027 | -0.0002 | - | +0.0012 | +0.0024 | +0.0050 |
| Level | Minor | Minor | Minor | - | Minor | Intermediate | Major |
To determine price objectives, it is also possible to use the pivot points. Here is the price position in relation to pivot points:
| Pivot points | S3 | S2 | S1 | PP | R1 | R2 | R3 |
|---|---|---|---|---|---|---|---|
| Standard | 1.3621 | 1.3639 | 1.3653 | 1.3671 | 1.3685 | 1.3703 | 1.3717 |
| Camarilla | 1.3657 | 1.3660 | 1.3663 | 1.3666 | 1.3669 | 1.3672 | 1.3675 |
| Woodie | 1.3618 | 1.3638 | 1.3650 | 1.3670 | 1.3682 | 1.3702 | 1.3714 |
| Fibonacci | 1.3639 | 1.3652 | 1.3659 | 1.3671 | 1.3684 | 1.3691 | 1.3703 |
| Pivot points | S3 | S2 | S1 | PP | R1 | R2 | R3 |
|---|---|---|---|---|---|---|---|
| Standard | 1.3487 | 1.3561 | 1.3616 | 1.3690 | 1.3745 | 1.3819 | 1.3874 |
| Camarilla | 1.3637 | 1.3648 | 1.3660 | 1.3672 | 1.3684 | 1.3696 | 1.3708 |
| Woodie | 1.3479 | 1.3556 | 1.3608 | 1.3685 | 1.3737 | 1.3814 | 1.3866 |
| Fibonacci | 1.3561 | 1.3610 | 1.3640 | 1.3690 | 1.3739 | 1.3769 | 1.3819 |
| Pivot points | S3 | S2 | S1 | PP | R1 | R2 | R3 |
|---|---|---|---|---|---|---|---|
| Standard | 1.3187 | 1.3333 | 1.3555 | 1.3701 | 1.3923 | 1.4069 | 1.4291 |
| Camarilla | 1.3677 | 1.3711 | 1.3744 | 1.3778 | 1.3812 | 1.3846 | 1.3879 |
| Woodie | 1.3226 | 1.3352 | 1.3594 | 1.3720 | 1.3962 | 1.4088 | 1.4330 |
| Fibonacci | 1.3333 | 1.3473 | 1.3560 | 1.3701 | 1.3841 | 1.3928 | 1.4069 |
Numerical data
The following are the details of the technical indicators and moving averages that were collected to generate this technical analysis:
| RSI (14): | 22.20 | |
| MACD (12,26,9): | -0.0007 | |
| Directional Movement: | 4.4090 | |
| AROON (14): | -7.1428 | |
| DEMA (21): | 1.3657 | |
| Parabolic SAR (0,02-0,02-0,2): | 1.3691 | |
| Elder Ray (13): | -0.0026 | |
| Super Trend (3,10): | 1.3669 | |
| Zig ZAG (10): | 1.3637 | |
| VORTEX (21): | 0.7892 | |
| Stochastique (14,3,5): | 6.27 | |
| TEMA (21): | 1.3652 | |
| Williams %R (14): | -94.83 | |
| Chande Momentum Oscillator (20): | -0.0047 | |
| Repulse (5,40,3): | -0.2442 | |
| ROCnROLL: | 2 | |
| TRIX (15,9): | -0.0025 | |
| Courbe Coppock: | 0.24 |
| MA7: | 1.3684 | |
| MA20: | 1.3700 | |
| MA50: | 1.3623 | |
| MA100: | 1.3535 | |
| MAexp7: | 1.3653 | |
| MAexp20: | 1.3664 | |
| MAexp50: | 1.3673 | |
| MAexp100: | 1.3682 | |
| Price / MA7: | -0.35% | |
| Price / MA20: | -0.47% | |
| Price / MA50: | +0.10% | |
| Price / MA100: | +0.75% | |
| Price / MAexp7: | -0.12% | |
| Price / MAexp20: | -0.20% | |
| Price / MAexp50: | -0.27% | |
| Price / MAexp100: | -0.34% |
News
The latest news and videos published on USD/CAD at the time of the analysis were as follows:
-
 Trade of the Week: Time to go long USDCAD?
-
USD/CAD Forecast May 8, 2024
-
USD/CAD Forecast May 2, 2024
-
USD/CAD Forecast April 10, 2024
-
Technical Analysis: 05/03/2024 - USDCAD ticks higher within ascending channel
About author

Online


Add a comment
Comments
0 comments on the analysis USD/CAD - 1H